29
/
en
AIzaSyAYiBZKx7MnpbEhh9jyipgxe19OcubqV5w
April 1, 2024
286705
Zambia
ZMB
true
2
1
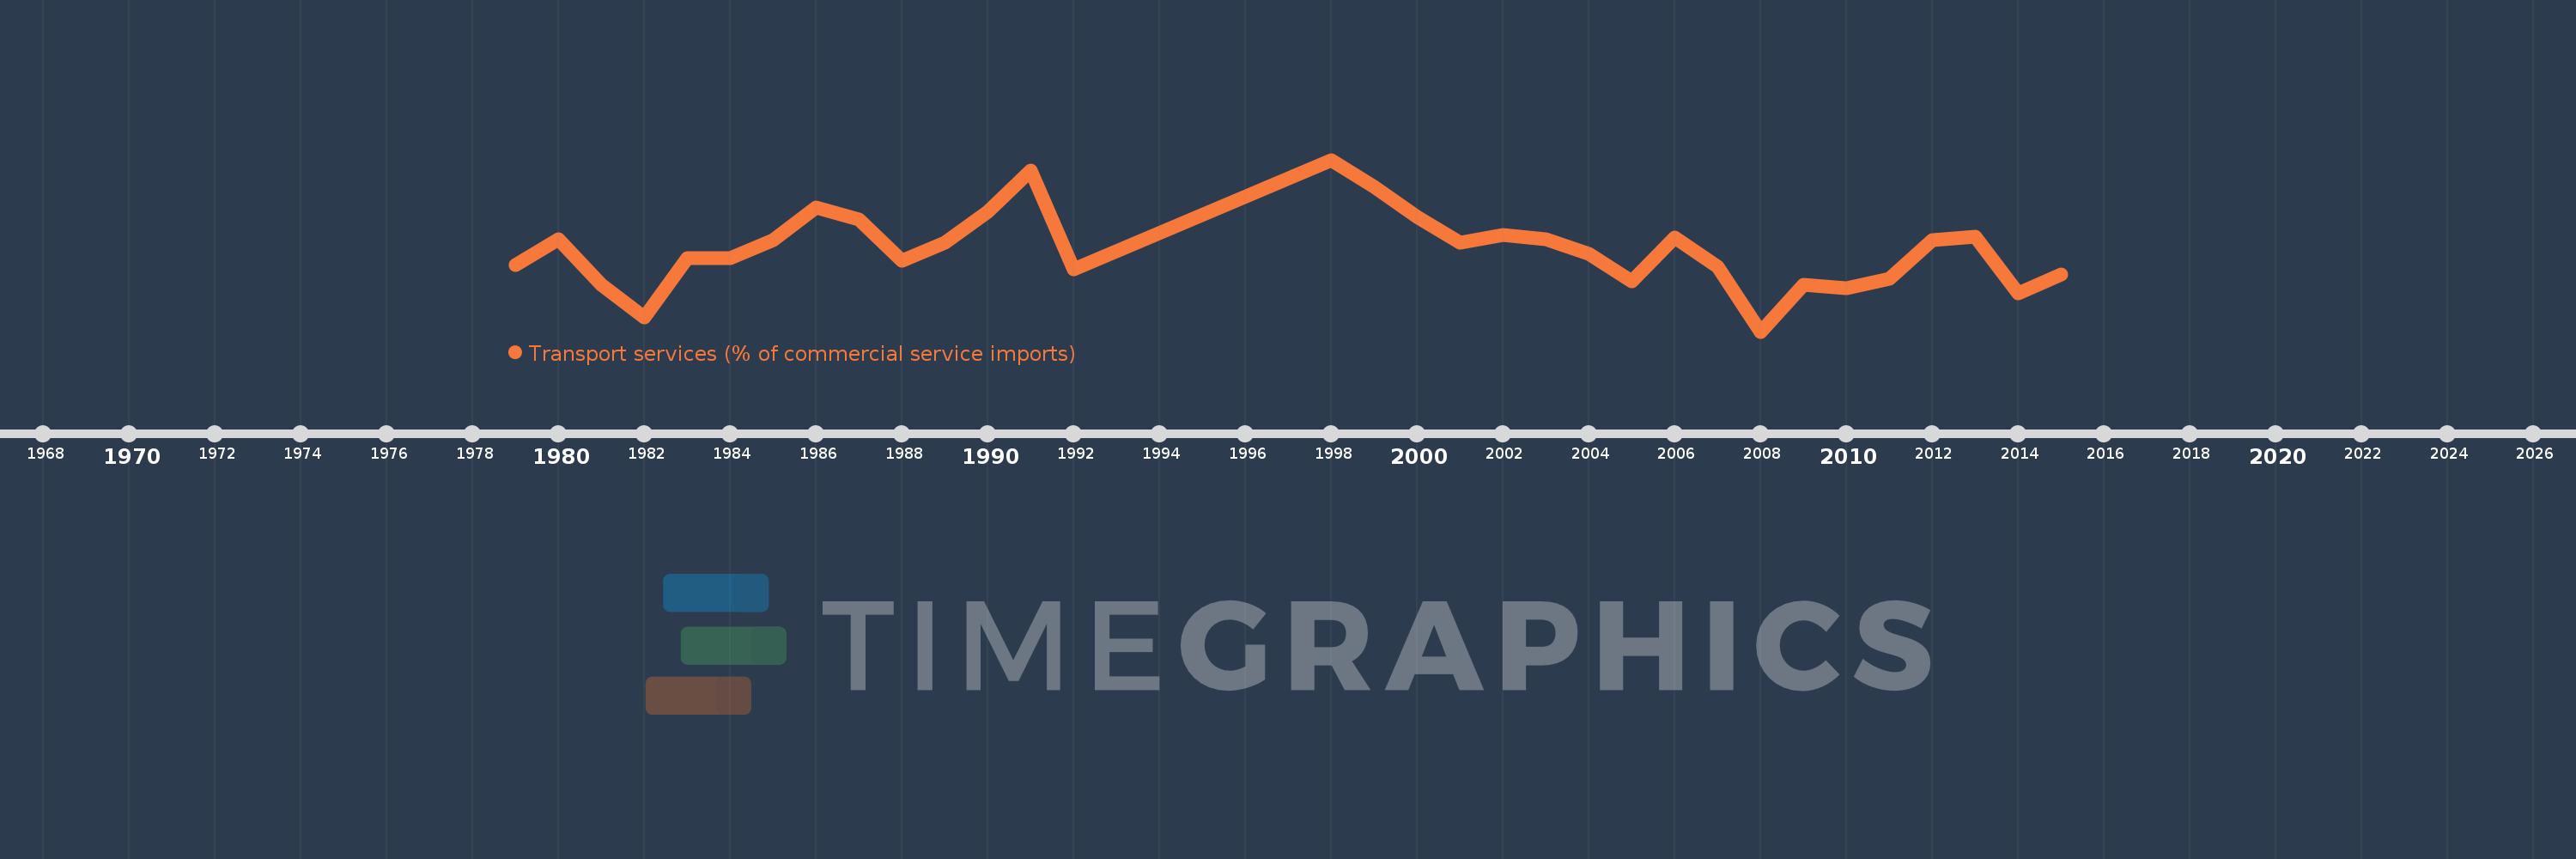
Transport services (% of commercial service imports)
2015,2014,2013,2012,2011,2010,2009,2008,2007,2006,2005,2004,2003,2002,2001,2000,1999,1998,1992,1991,1990,1989,1988,1987,1986,1985,1984,1983,1982,1981,1980,1979
This statistics in other country:
AfghanistanAlbaniaAlgeriaAngolaAntigua and BarbudaArab WorldArgentinaArmeniaArubaAustraliaAustriaAzerbaijanBahamas, TheBahrainBangladeshBarbadosBelarusBelgiumBelizeBeninBermudaBhutanBoliviaBosnia and HerzegovinaBotswanaBrazilBrunei DarussalamBulgariaBurkina FasoBurundiCabo VerdeCambodiaCameroonCanadaCaribbean small statesCentral African RepublicCentral Europe and the BalticsChadChileChinaColombiaComorosCongo, Dem. Rep.Congo, Rep.Costa RicaCote d'IvoireCroatiaCuracaoCyprusCzech RepublicDenmarkDjiboutiDominicaDominican RepublicEarly-demographic dividendEast Asia & PacificEast Asia & Pacific (excluding high income)East Asia & Pacific (IDA & IBRD countries)EcuadorEgypt, Arab Rep.El SalvadorEquatorial GuineaEritreaEstoniaEthiopiaEuro areaEurope & Central AsiaEurope & Central Asia (excluding high income)Europe & Central Asia (IDA & IBRD countries)European UnionFaroe IslandsFijiFinlandFragile and conflict affected situationsFranceFrench PolynesiaGabonGambia, TheGeorgiaGermanyGhanaGreeceGrenadaGuatemalaGuineaGuinea-BissauGuyanaHaitiHeavily indebted poor countries (HIPC)High incomeHondurasHong Kong SAR, ChinaHungaryIBRD onlyIcelandIDA & IBRD totalIDA onlyIDA totalIndiaIndonesiaIran, Islamic Rep.IraqIrelandIsraelItalyJamaicaJapanJordanKazakhstanKenyaKiribatiKorea, Rep.KosovoKuwaitKyrgyz RepublicLao PDRLate-demographic dividendLatin America & Caribbean Latin America & Caribbean (excluding high income)Latin America & the Caribbean (IDA & IBRD countries)LatviaLeast developed countries: UN classificationLebanonLesothoLiberiaLibyaLithuaniaLow & middle incomeLow incomeLower middle incomeLuxembourgMacao SAR, ChinaMacedonia, FYRMadagascarMalawiMalaysiaMaldivesMaliMaltaMarshall IslandsMauritaniaMauritiusMexicoMicronesia, Fed. Sts.Middle East & North AfricaMiddle East & North Africa (excluding high income)Middle East & North Africa (IDA & IBRD countries)Middle incomeMoldovaMongoliaMontenegroMoroccoMozambiqueMyanmarNamibiaNepalNetherlandsNew CaledoniaNew ZealandNicaraguaNigerNigeriaNorth AmericaNorwayOECD membersOmanOther small statesPacific island small statesPakistanPalauPanamaPapua New GuineaParaguayPeruPhilippinesPolandPortugalPost-demographic dividendPre-demographic dividendQatarRomaniaRussian FederationRwandaSamoaSao Tome and PrincipeSaudi ArabiaSenegalSerbiaSeychellesSierra LeoneSingaporeSint Maarten (Dutch part)Slovak RepublicSloveniaSmall statesSolomon IslandsSouth AfricaSouth AsiaSouth Asia (IDA & IBRD)South SudanSpainSri LankaSt. Kitts and NevisSt. LuciaSt. Vincent and the GrenadinesSub-Saharan Africa Sub-Saharan Africa (excluding high income)Sub-Saharan Africa (IDA & IBRD countries)SudanSurinameSwazilandSwedenSwitzerlandSyrian Arab RepublicTajikistanTanzaniaThailandTimor-LesteTogoTongaTrinidad and TobagoTunisiaTurkeyTuvaluUgandaUkraineUnited KingdomUnited StatesUpper middle incomeUruguayVanuatuVenezuela, RBWest Bank and GazaWorldYemen, Rep.ZambiaZimbabwe Timeline:
This timeline shows a graph from 1979 to 2015 of Zambia. No data until 1978. Number of actual observations by date: 32.
Source name:
World Development Indicators
Source organization:
International Monetary Fund, Balance of Payments Statistics Yearbook and data files.
Categories, topics:
Private Sector, Trade
Last updated:
apr 23, 2017
Indicators value changes by year
Minimum:
45.545
jan 1, 2008
Maximum:
78.878
jan 1, 1998
At the date of observation
Value
Absolute change
Change from previous value
jan 1, 1979
58.411
+58.411
0.0%
jan 1, 1980
63.436
+5.025
8.6%
jan 1, 1981
54.574
-8.862
-13.97%
jan 1, 1982
48.319
-6.255
-11.46%
jan 1, 1983
59.759
+11.439
23.67%
jan 1, 1984
59.819
+0.061
0.1%
jan 1, 1985
63.235
+3.416
5.71%
jan 1, 1986
69.583
+6.348
10.04%
jan 1, 1987
67.243
-2.339
-3.36%
jan 1, 1988
59.306
-7.938
-11.8%
jan 1, 1989
62.826
+3.521
5.94%
jan 1, 1990
68.782
+5.956
9.48%
jan 1, 1991
76.79
+8.008
11.64%
jan 1, 1992
57.707
-19.084
-24.85%
jan 1, 1998
78.878
+21.172
36.69%
jan 1, 1999
73.669
-5.209
-6.6%
jan 1, 2000
67.876
-5.793
-7.86%
jan 1, 2001
62.771
-5.106
-7.52%
jan 1, 2002
64.375
+1.605
2.56%
jan 1, 2003
63.533
-0.842
-1.31%
jan 1, 2004
60.572
-2.961
-4.66%
jan 1, 2005
55.266
-5.307
-8.76%
jan 1, 2006
63.815
+8.55
15.47%
jan 1, 2007
58.182
-5.634
-8.83%
jan 1, 2008
45.545
-12.636
-21.72%
jan 1, 2009
54.551
+9.006
19.77%
jan 1, 2010
53.913
-0.638
-1.17%
jan 1, 2011
55.829
+1.916
3.55%
jan 1, 2012
63.293
+7.464
13.37%
jan 1, 2013
63.911
+0.618
0.98%
jan 1, 2014
52.942
-10.968
-17.16%
jan 1, 2015
56.584
+3.642
6.88%
Ranking of countries by current statistics by years


Comments: