29
/
en
AIzaSyAYiBZKx7MnpbEhh9jyipgxe19OcubqV5w
April 1, 2024
111739
Congo, Rep.
COG
true
2
1
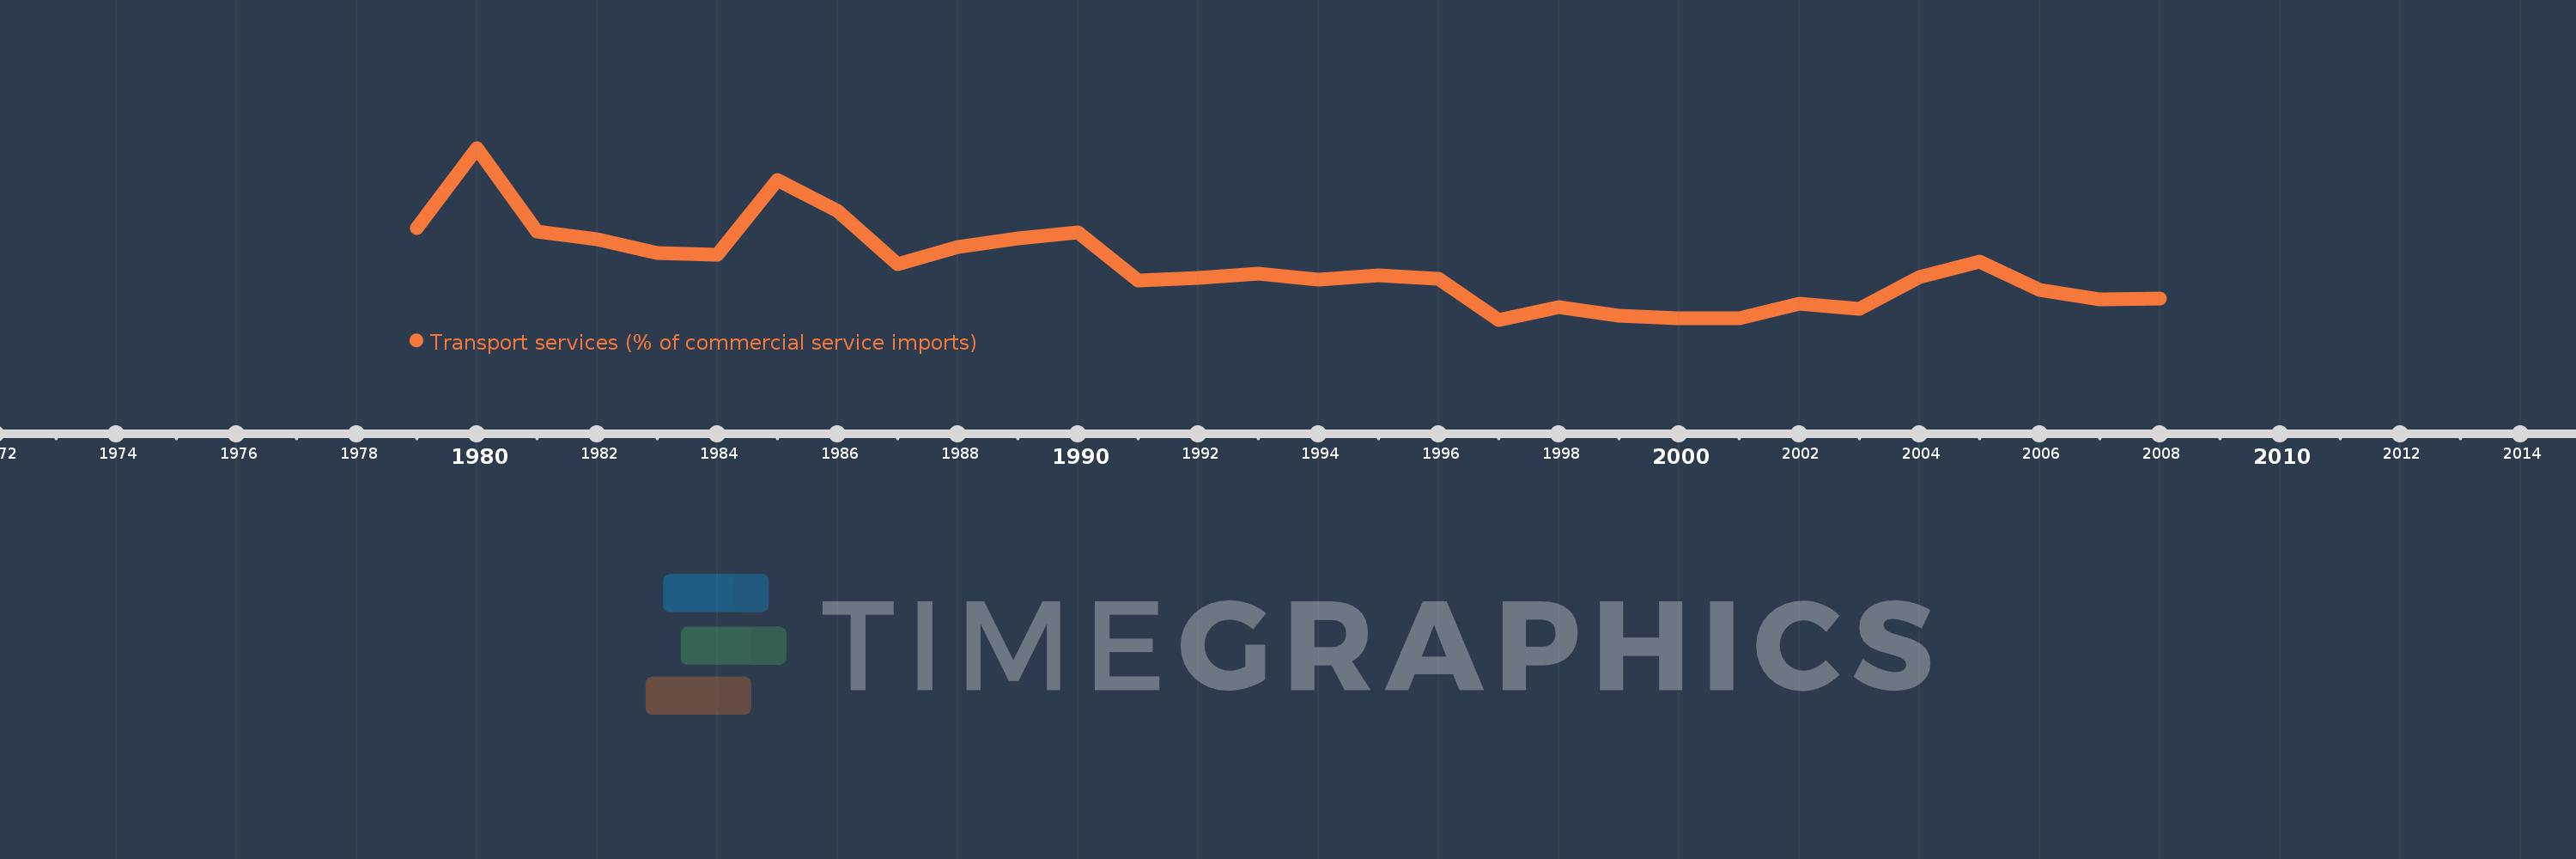
Transport services (% of commercial service imports)
2008,2007,2006,2005,2004,2003,2002,2001,2000,1999,1998,1997,1996,1995,1994,1993,1992,1991,1990,1989,1988,1987,1986,1985,1984,1983,1982,1981,1980,1979
This statistics in other country:
AfghanistanAlbaniaAlgeriaAngolaAntigua and BarbudaArab WorldArgentinaArmeniaArubaAustraliaAustriaAzerbaijanBahamas, TheBahrainBangladeshBarbadosBelarusBelgiumBelizeBeninBermudaBhutanBoliviaBosnia and HerzegovinaBotswanaBrazilBrunei DarussalamBulgariaBurkina FasoBurundiCabo VerdeCambodiaCameroonCanadaCaribbean small statesCentral African RepublicCentral Europe and the BalticsChadChileChinaColombiaComorosCongo, Dem. Rep.Congo, Rep.Costa RicaCote d'IvoireCroatiaCuracaoCyprusCzech RepublicDenmarkDjiboutiDominicaDominican RepublicEarly-demographic dividendEast Asia & PacificEast Asia & Pacific (excluding high income)East Asia & Pacific (IDA & IBRD countries)EcuadorEgypt, Arab Rep.El SalvadorEquatorial GuineaEritreaEstoniaEthiopiaEuro areaEurope & Central AsiaEurope & Central Asia (excluding high income)Europe & Central Asia (IDA & IBRD countries)European UnionFaroe IslandsFijiFinlandFragile and conflict affected situationsFranceFrench PolynesiaGabonGambia, TheGeorgiaGermanyGhanaGreeceGrenadaGuatemalaGuineaGuinea-BissauGuyanaHaitiHeavily indebted poor countries (HIPC)High incomeHondurasHong Kong SAR, ChinaHungaryIBRD onlyIcelandIDA & IBRD totalIDA onlyIDA totalIndiaIndonesiaIran, Islamic Rep.IraqIrelandIsraelItalyJamaicaJapanJordanKazakhstanKenyaKiribatiKorea, Rep.KosovoKuwaitKyrgyz RepublicLao PDRLate-demographic dividendLatin America & Caribbean Latin America & Caribbean (excluding high income)Latin America & the Caribbean (IDA & IBRD countries)LatviaLeast developed countries: UN classificationLebanonLesothoLiberiaLibyaLithuaniaLow & middle incomeLow incomeLower middle incomeLuxembourgMacao SAR, ChinaMacedonia, FYRMadagascarMalawiMalaysiaMaldivesMaliMaltaMarshall IslandsMauritaniaMauritiusMexicoMicronesia, Fed. Sts.Middle East & North AfricaMiddle East & North Africa (excluding high income)Middle East & North Africa (IDA & IBRD countries)Middle incomeMoldovaMongoliaMontenegroMoroccoMozambiqueMyanmarNamibiaNepalNetherlandsNew CaledoniaNew ZealandNicaraguaNigerNigeriaNorth AmericaNorwayOECD membersOmanOther small statesPacific island small statesPakistanPalauPanamaPapua New GuineaParaguayPeruPhilippinesPolandPortugalPost-demographic dividendPre-demographic dividendQatarRomaniaRussian FederationRwandaSamoaSao Tome and PrincipeSaudi ArabiaSenegalSerbiaSeychellesSierra LeoneSingaporeSint Maarten (Dutch part)Slovak RepublicSloveniaSmall statesSolomon IslandsSouth AfricaSouth AsiaSouth Asia (IDA & IBRD)South SudanSpainSri LankaSt. Kitts and NevisSt. LuciaSt. Vincent and the GrenadinesSub-Saharan Africa Sub-Saharan Africa (excluding high income)Sub-Saharan Africa (IDA & IBRD countries)SudanSurinameSwazilandSwedenSwitzerlandSyrian Arab RepublicTajikistanTanzaniaThailandTimor-LesteTogoTongaTrinidad and TobagoTunisiaTurkeyTuvaluUgandaUkraineUnited KingdomUnited StatesUpper middle incomeUruguayVanuatuVenezuela, RBWest Bank and GazaWorldYemen, Rep.ZambiaZimbabwe Timeline:
This timeline shows a graph from 1979 to 2008 of Congo, Rep.. No data until 1978. Number of actual observations by date: 30.
Source name:
World Development Indicators
Source organization:
International Monetary Fund, Balance of Payments Statistics Yearbook and data files.
Categories, topics:
Private Sector, Trade
Last updated:
apr 23, 2017
Indicators value changes by year
Minimum:
11.053
jan 1, 1997
Maximum:
42.994
jan 1, 1980
At the date of observation
Value
Absolute change
Change from previous value
jan 1, 1979
28.021
+28.021
0.0%
jan 1, 1980
42.994
+14.973
53.44%
jan 1, 1981
27.386
-15.608
-36.3%
jan 1, 1982
26.047
-1.339
-4.89%
jan 1, 1983
23.521
-2.526
-9.7%
jan 1, 1984
23.087
-0.434
-1.84%
jan 1, 1985
37.116
+14.028
60.76%
jan 1, 1986
31.213
-5.902
-15.9%
jan 1, 1987
21.442
-9.771
-31.3%
jan 1, 1988
24.559
+3.117
14.54%
jan 1, 1989
26.196
+1.637
6.67%
jan 1, 1990
27.294
+1.098
4.19%
jan 1, 1991
18.38
-8.914
-32.66%
jan 1, 1992
18.814
+0.434
2.36%
jan 1, 1993
19.666
+0.852
4.53%
jan 1, 1994
18.575
-1.091
-5.55%
jan 1, 1995
19.298
+0.723
3.89%
jan 1, 1996
18.593
-0.705
-3.65%
jan 1, 1997
11.053
-7.54
-40.55%
jan 1, 1998
13.321
+2.268
20.52%
jan 1, 1999
11.731
-1.589
-11.93%
jan 1, 2000
11.386
-0.346
-2.95%
jan 1, 2001
11.293
-0.093
-0.81%
jan 1, 2002
14.112
+2.818
24.96%
jan 1, 2003
13.057
-1.055
-7.47%
jan 1, 2004
18.931
+5.874
44.99%
jan 1, 2005
21.807
+2.875
15.19%
jan 1, 2006
16.64
-5.167
-23.69%
jan 1, 2007
14.895
-1.745
-10.49%
jan 1, 2008
15.021
+0.126
0.85%
Ranking of countries by current statistics by years


Comments: