29
/
en
AIzaSyAYiBZKx7MnpbEhh9jyipgxe19OcubqV5w
April 1, 2024
213777
Nigeria
NGA
true
2
1
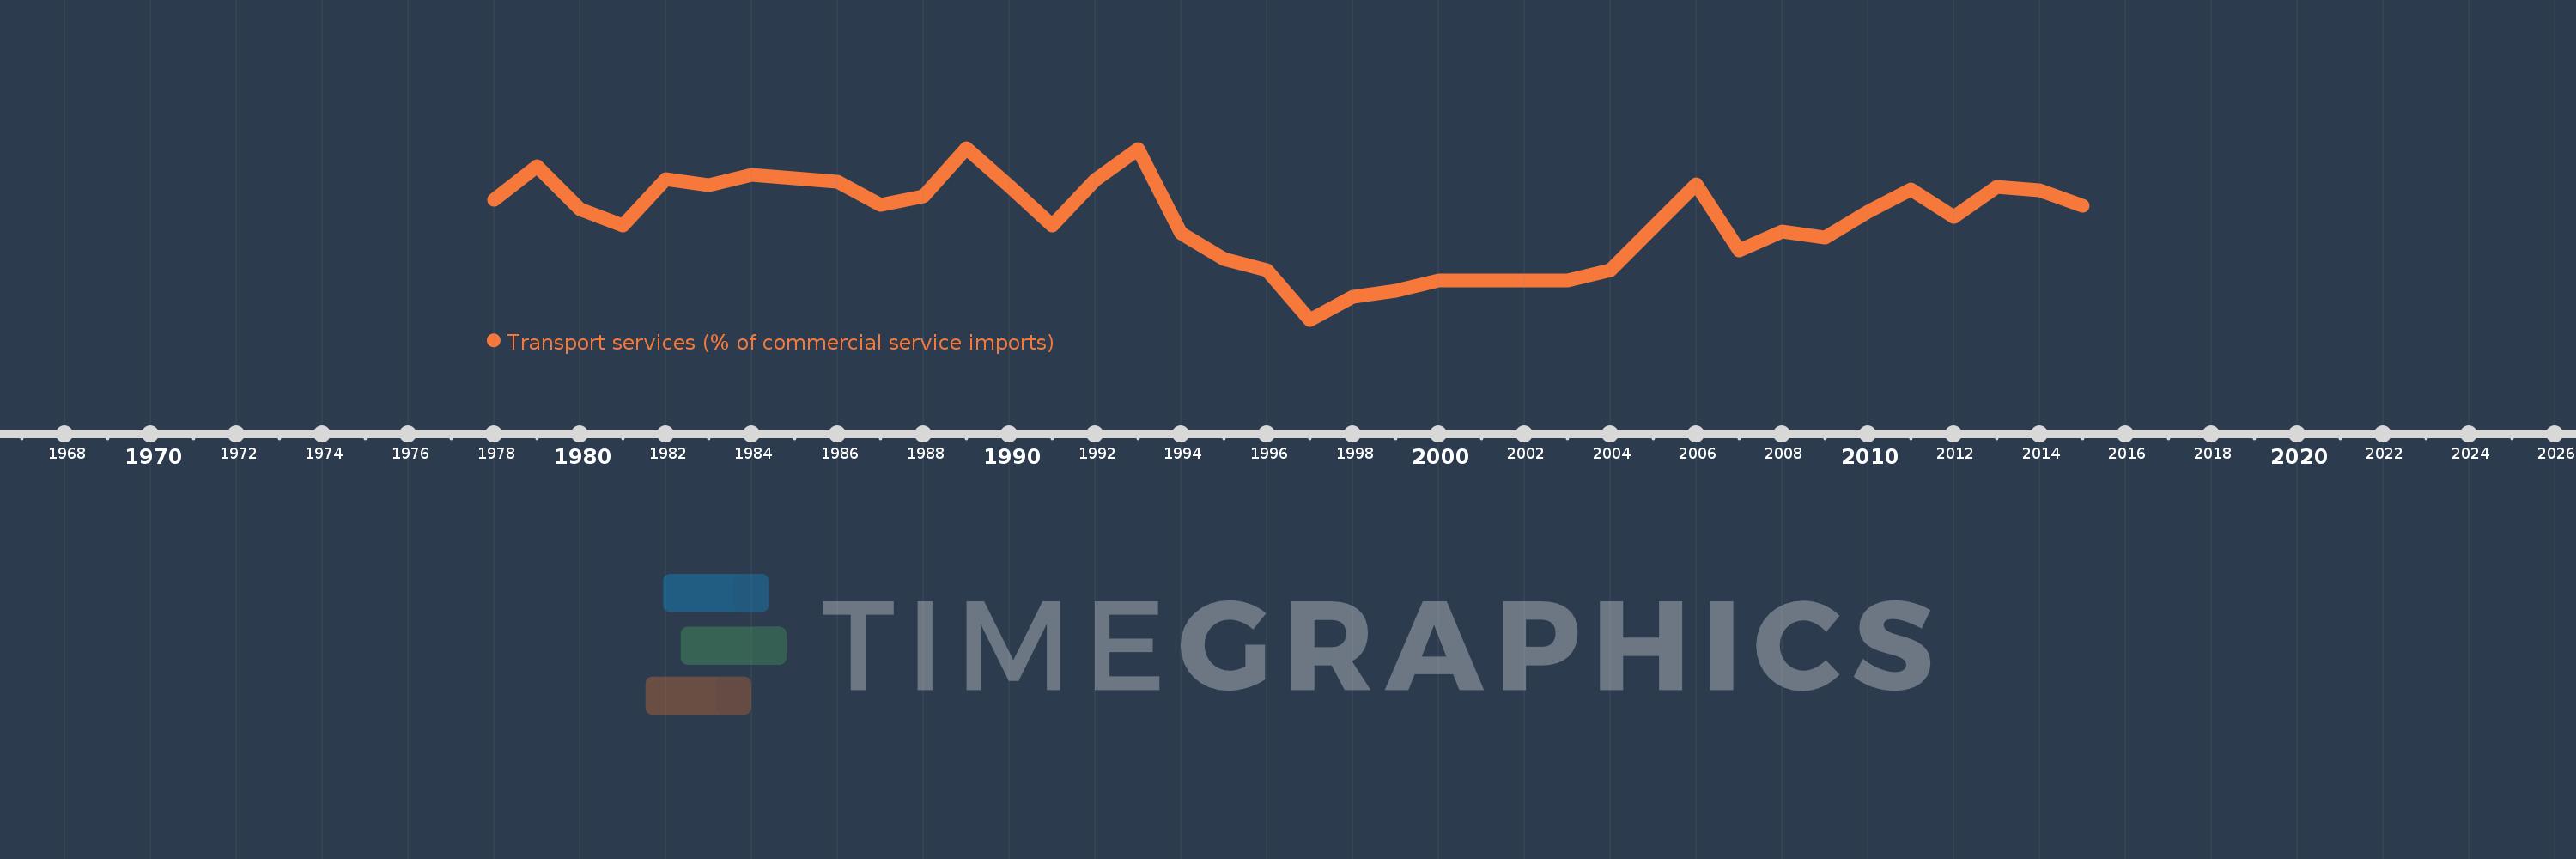
Transport services (% of commercial service imports)
2015,2014,2013,2012,2011,2010,2009,2008,2007,2006,2004,2003,2002,2001,2000,1999,1998,1997,1996,1995,1994,1993,1992,1991,1990,1989,1988,1987,1986,1985,1984,1983,1982,1981,1980,1979,1978
This statistics in other country:
AfghanistanAlbaniaAlgeriaAngolaAntigua and BarbudaArab WorldArgentinaArmeniaArubaAustraliaAustriaAzerbaijanBahamas, TheBahrainBangladeshBarbadosBelarusBelgiumBelizeBeninBermudaBhutanBoliviaBosnia and HerzegovinaBotswanaBrazilBrunei DarussalamBulgariaBurkina FasoBurundiCabo VerdeCambodiaCameroonCanadaCaribbean small statesCentral African RepublicCentral Europe and the BalticsChadChileChinaColombiaComorosCongo, Dem. Rep.Congo, Rep.Costa RicaCote d'IvoireCroatiaCuracaoCyprusCzech RepublicDenmarkDjiboutiDominicaDominican RepublicEarly-demographic dividendEast Asia & PacificEast Asia & Pacific (excluding high income)East Asia & Pacific (IDA & IBRD countries)EcuadorEgypt, Arab Rep.El SalvadorEquatorial GuineaEritreaEstoniaEthiopiaEuro areaEurope & Central AsiaEurope & Central Asia (excluding high income)Europe & Central Asia (IDA & IBRD countries)European UnionFaroe IslandsFijiFinlandFragile and conflict affected situationsFranceFrench PolynesiaGabonGambia, TheGeorgiaGermanyGhanaGreeceGrenadaGuatemalaGuineaGuinea-BissauGuyanaHaitiHeavily indebted poor countries (HIPC)High incomeHondurasHong Kong SAR, ChinaHungaryIBRD onlyIcelandIDA & IBRD totalIDA onlyIDA totalIndiaIndonesiaIran, Islamic Rep.IraqIrelandIsraelItalyJamaicaJapanJordanKazakhstanKenyaKiribatiKorea, Rep.KosovoKuwaitKyrgyz RepublicLao PDRLate-demographic dividendLatin America & Caribbean Latin America & Caribbean (excluding high income)Latin America & the Caribbean (IDA & IBRD countries)LatviaLeast developed countries: UN classificationLebanonLesothoLiberiaLibyaLithuaniaLow & middle incomeLow incomeLower middle incomeLuxembourgMacao SAR, ChinaMacedonia, FYRMadagascarMalawiMalaysiaMaldivesMaliMaltaMarshall IslandsMauritaniaMauritiusMexicoMicronesia, Fed. Sts.Middle East & North AfricaMiddle East & North Africa (excluding high income)Middle East & North Africa (IDA & IBRD countries)Middle incomeMoldovaMongoliaMontenegroMoroccoMozambiqueMyanmarNamibiaNepalNetherlandsNew CaledoniaNew ZealandNicaraguaNigerNigeriaNorth AmericaNorwayOECD membersOmanOther small statesPacific island small statesPakistanPalauPanamaPapua New GuineaParaguayPeruPhilippinesPolandPortugalPost-demographic dividendPre-demographic dividendQatarRomaniaRussian FederationRwandaSamoaSao Tome and PrincipeSaudi ArabiaSenegalSerbiaSeychellesSierra LeoneSingaporeSint Maarten (Dutch part)Slovak RepublicSloveniaSmall statesSolomon IslandsSouth AfricaSouth AsiaSouth Asia (IDA & IBRD)South SudanSpainSri LankaSt. Kitts and NevisSt. LuciaSt. Vincent and the GrenadinesSub-Saharan Africa Sub-Saharan Africa (excluding high income)Sub-Saharan Africa (IDA & IBRD countries)SudanSurinameSwazilandSwedenSwitzerlandSyrian Arab RepublicTajikistanTanzaniaThailandTimor-LesteTogoTongaTrinidad and TobagoTunisiaTurkeyTuvaluUgandaUkraineUnited KingdomUnited StatesUpper middle incomeUruguayVanuatuVenezuela, RBWest Bank and GazaWorldYemen, Rep.ZambiaZimbabwe Timeline:
This timeline shows a graph from 1978 to 2015 of Nigeria. No data until 1977. Number of actual observations by date: 37.
Source name:
World Development Indicators
Source organization:
International Monetary Fund, Balance of Payments Statistics Yearbook and data files.
Categories, topics:
Private Sector, Trade
Last updated:
apr 23, 2017
Indicators value changes by year
Maximum:
53.207
jan 1, 1989
At the date of observation
Value
Absolute change
Change from previous value
jan 1, 1978
40.117
+40.117
0.0%
jan 1, 1979
48.653
+8.535
21.28%
jan 1, 1980
37.797
-10.856
-22.31%
jan 1, 1981
33.702
-4.094
-10.83%
jan 1, 1982
45.299
+11.597
34.41%
jan 1, 1983
43.792
-1.507
-3.33%
jan 1, 1984
46.492
+2.7
6.16%
jan 1, 1985
45.519
-0.973
-2.09%
jan 1, 1986
44.711
-0.808
-1.78%
jan 1, 1987
38.931
-5.78
-12.93%
jan 1, 1988
41.088
+2.157
5.54%
jan 1, 1989
53.207
+12.119
29.49%
jan 1, 1990
43.687
-9.52
-17.89%
jan 1, 1991
33.631
-10.057
-23.02%
jan 1, 1992
45.193
+11.563
34.38%
jan 1, 1993
52.976
+7.783
17.22%
jan 1, 1994
31.815
-21.161
-39.95%
jan 1, 1995
25.296
-6.518
-20.49%
jan 1, 1996
22.441
-2.855
-11.29%
jan 1, 1997
9.998
-12.443
-55.45%
jan 1, 1998
15.856
+5.857
58.58%
jan 1, 1999
17.365
+1.509
9.52%
jan 1, 2000
19.846
+2.481
14.29%
jan 1, 2001
19.84
-0.005
-0.03%
jan 1, 2002
19.84
+0.0
0.0%
jan 1, 2003
19.84
0.0
0.0%
jan 1, 2004
22.46
+2.62
13.2%
jan 1, 2006
44.108
+21.648
96.38%
jan 1, 2007
27.363
-16.745
-37.96%
jan 1, 2008
32.156
+4.793
17.52%
jan 1, 2009
30.601
-1.555
-4.83%
jan 1, 2010
37.076
+6.475
21.16%
jan 1, 2011
42.81
+5.733
15.46%
jan 1, 2012
35.923
-6.886
-16.09%
jan 1, 2013
43.448
+7.524
20.95%
jan 1, 2014
42.545
-0.903
-2.08%
jan 1, 2015
38.641
-3.904
-9.18%
Ranking of countries by current statistics by years


Comments: