29
/
en
AIzaSyAYiBZKx7MnpbEhh9jyipgxe19OcubqV5w
April 1, 2024
235232
Saudi Arabia
SAU
true
2
1
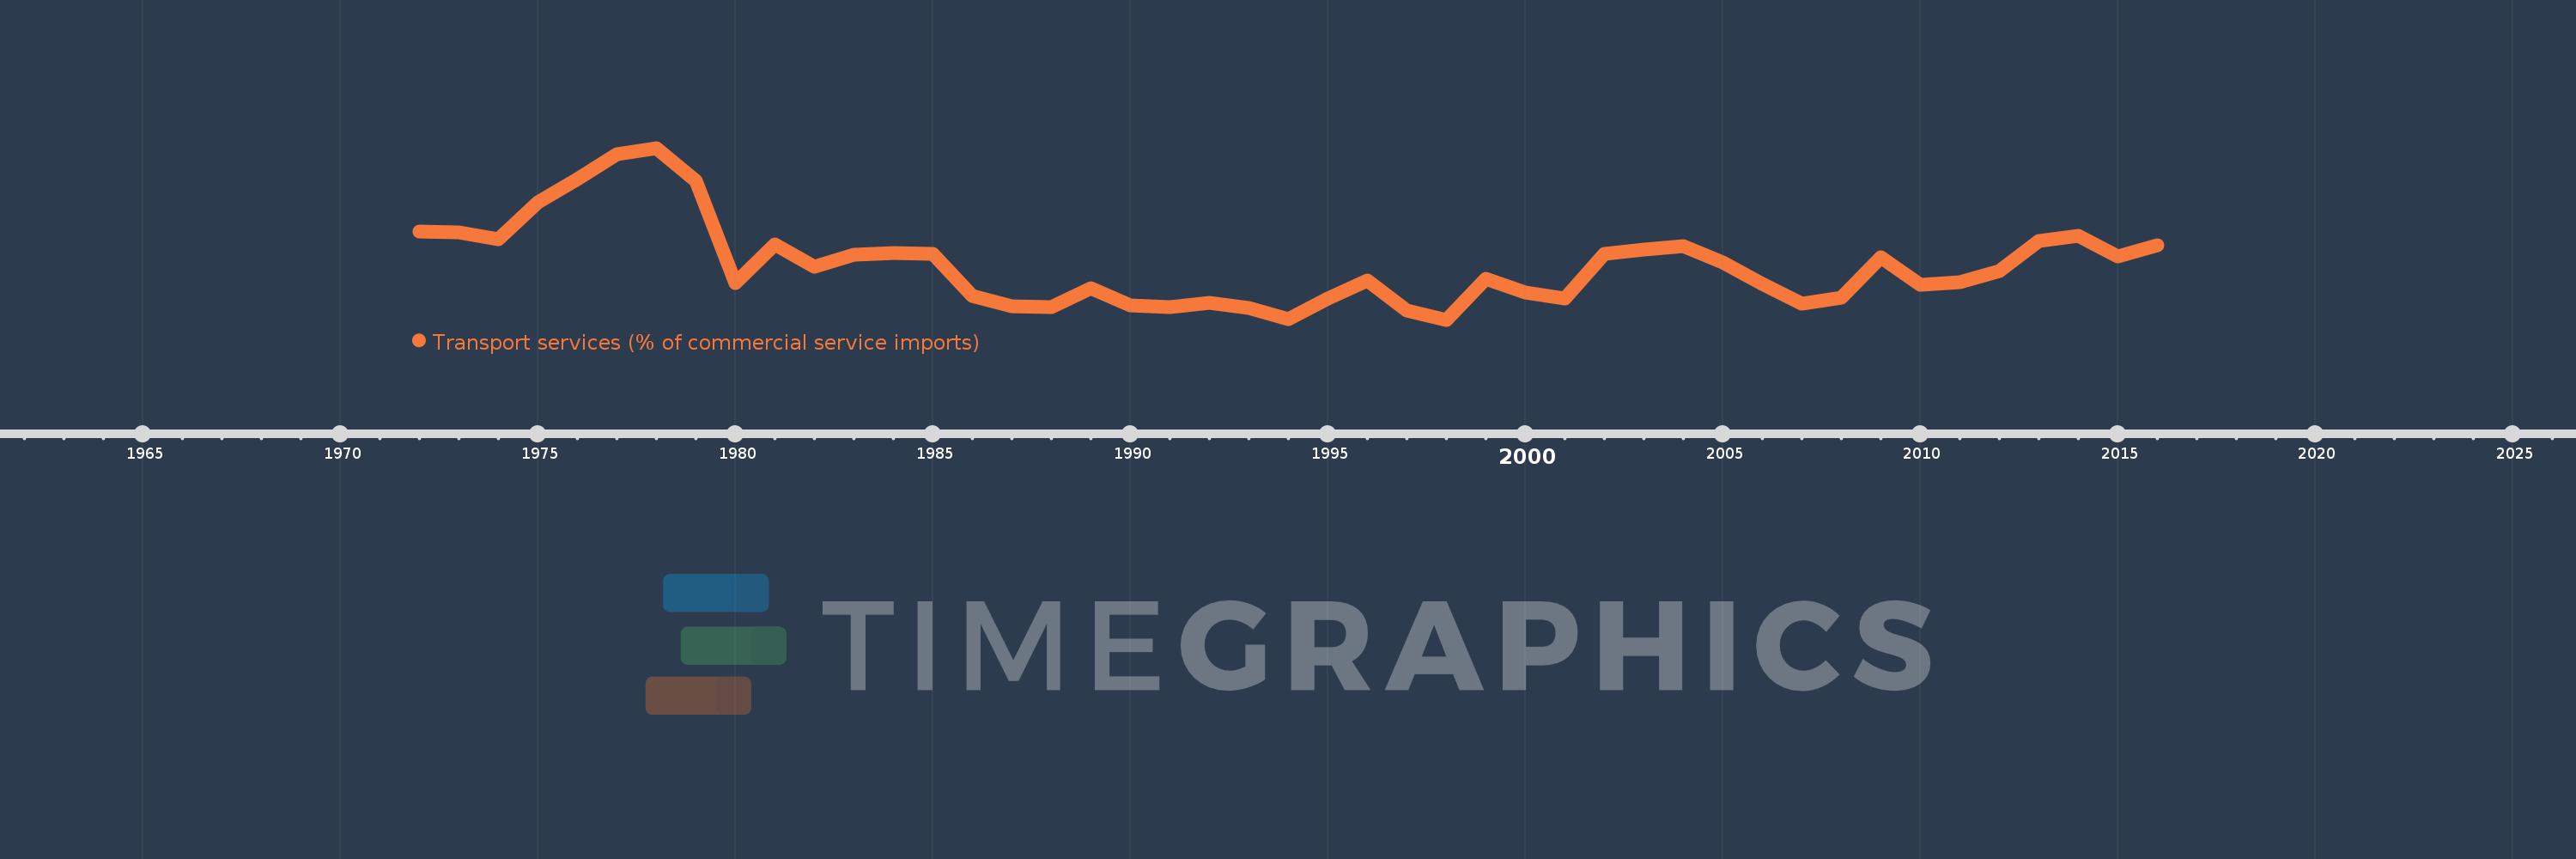
Transport services (% of commercial service imports)
2016,2015,2014,2013,2012,2011,2010,2009,2008,2007,2006,2005,2004,2003,2002,2001,2000,1999,1998,1997,1996,1995,1994,1993,1992,1991,1990,1989,1988,1987,1986,1985,1984,1983,1982,1981,1980,1979,1978,1977,1976,1975,1974,1973,1972
This statistics in other country:
AfghanistanAlbaniaAlgeriaAngolaAntigua and BarbudaArab WorldArgentinaArmeniaArubaAustraliaAustriaAzerbaijanBahamas, TheBahrainBangladeshBarbadosBelarusBelgiumBelizeBeninBermudaBhutanBoliviaBosnia and HerzegovinaBotswanaBrazilBrunei DarussalamBulgariaBurkina FasoBurundiCabo VerdeCambodiaCameroonCanadaCaribbean small statesCentral African RepublicCentral Europe and the BalticsChadChileChinaColombiaComorosCongo, Dem. Rep.Congo, Rep.Costa RicaCote d'IvoireCroatiaCuracaoCyprusCzech RepublicDenmarkDjiboutiDominicaDominican RepublicEarly-demographic dividendEast Asia & PacificEast Asia & Pacific (excluding high income)East Asia & Pacific (IDA & IBRD countries)EcuadorEgypt, Arab Rep.El SalvadorEquatorial GuineaEritreaEstoniaEthiopiaEuro areaEurope & Central AsiaEurope & Central Asia (excluding high income)Europe & Central Asia (IDA & IBRD countries)European UnionFaroe IslandsFijiFinlandFragile and conflict affected situationsFranceFrench PolynesiaGabonGambia, TheGeorgiaGermanyGhanaGreeceGrenadaGuatemalaGuineaGuinea-BissauGuyanaHaitiHeavily indebted poor countries (HIPC)High incomeHondurasHong Kong SAR, ChinaHungaryIBRD onlyIcelandIDA & IBRD totalIDA onlyIDA totalIndiaIndonesiaIran, Islamic Rep.IraqIrelandIsraelItalyJamaicaJapanJordanKazakhstanKenyaKiribatiKorea, Rep.KosovoKuwaitKyrgyz RepublicLao PDRLate-demographic dividendLatin America & Caribbean Latin America & Caribbean (excluding high income)Latin America & the Caribbean (IDA & IBRD countries)LatviaLeast developed countries: UN classificationLebanonLesothoLiberiaLibyaLithuaniaLow & middle incomeLow incomeLower middle incomeLuxembourgMacao SAR, ChinaMacedonia, FYRMadagascarMalawiMalaysiaMaldivesMaliMaltaMarshall IslandsMauritaniaMauritiusMexicoMicronesia, Fed. Sts.Middle East & North AfricaMiddle East & North Africa (excluding high income)Middle East & North Africa (IDA & IBRD countries)Middle incomeMoldovaMongoliaMontenegroMoroccoMozambiqueMyanmarNamibiaNepalNetherlandsNew CaledoniaNew ZealandNicaraguaNigerNigeriaNorth AmericaNorwayOECD membersOmanOther small statesPacific island small statesPakistanPalauPanamaPapua New GuineaParaguayPeruPhilippinesPolandPortugalPost-demographic dividendPre-demographic dividendQatarRomaniaRussian FederationRwandaSamoaSao Tome and PrincipeSaudi ArabiaSenegalSerbiaSeychellesSierra LeoneSingaporeSint Maarten (Dutch part)Slovak RepublicSloveniaSmall statesSolomon IslandsSouth AfricaSouth AsiaSouth Asia (IDA & IBRD)South SudanSpainSri LankaSt. Kitts and NevisSt. LuciaSt. Vincent and the GrenadinesSub-Saharan Africa Sub-Saharan Africa (excluding high income)Sub-Saharan Africa (IDA & IBRD countries)SudanSurinameSwazilandSwedenSwitzerlandSyrian Arab RepublicTajikistanTanzaniaThailandTimor-LesteTogoTongaTrinidad and TobagoTunisiaTurkeyTuvaluUgandaUkraineUnited KingdomUnited StatesUpper middle incomeUruguayVanuatuVenezuela, RBWest Bank and GazaWorldYemen, Rep.ZambiaZimbabwe Timeline:
This timeline shows a graph from 1972 to 2016 of Saudi Arabia. No data until 1971. Number of actual observations by date: 45.
Source name:
World Development Indicators
Source organization:
International Monetary Fund, Balance of Payments Statistics Yearbook and data files.
Categories, topics:
Private Sector, Trade
Last updated:
apr 23, 2017
Indicators value changes by year
Minimum:
14.821
jan 1, 1998
Maximum:
60.838
jan 1, 1978
At the date of observation
Value
Absolute change
Change from previous value
jan 1, 1972
38.532
+38.532
0.0%
jan 1, 1973
38.158
-0.374
-0.97%
jan 1, 1974
36.402
-1.756
-4.6%
jan 1, 1975
46.194
+9.793
26.9%
jan 1, 1976
52.432
+6.238
13.5%
jan 1, 1977
59.091
+6.658
12.7%
jan 1, 1978
60.838
+1.747
2.96%
jan 1, 1979
52.14
-8.698
-14.3%
jan 1, 1980
24.724
-27.416
-52.58%
jan 1, 1981
34.961
+10.237
41.4%
jan 1, 1982
29.111
-5.85
-16.73%
jan 1, 1983
32.14
+3.029
10.41%
jan 1, 1984
32.763
+0.623
1.94%
jan 1, 1985
32.574
-0.19
-0.58%
jan 1, 1986
21.215
-11.359
-34.87%
jan 1, 1987
18.462
-2.752
-12.97%
jan 1, 1988
18.279
-0.183
-0.99%
jan 1, 1989
23.303
+5.024
27.48%
jan 1, 1990
18.699
-4.604
-19.76%
jan 1, 1991
18.09
-0.609
-3.26%
jan 1, 1992
19.327
+1.237
6.84%
jan 1, 1993
17.937
-1.39
-7.19%
jan 1, 1994
15.048
-2.889
-16.1%
jan 1, 1995
20.423
+5.374
35.71%
jan 1, 1996
25.263
+4.841
23.7%
jan 1, 1997
17.199
-8.064
-31.92%
jan 1, 1998
14.821
-2.378
-13.83%
jan 1, 1999
25.755
+10.934
73.77%
jan 1, 2000
22.072
-3.683
-14.3%
jan 1, 2001
20.535
-1.536
-6.96%
jan 1, 2002
32.386
+11.85
57.71%
jan 1, 2003
33.552
+1.166
3.6%
jan 1, 2004
34.565
+1.014
3.02%
jan 1, 2005
30.07
-4.495
-13.01%
jan 1, 2006
24.344
-5.726
-19.04%
jan 1, 2007
19.049
-5.295
-21.75%
jan 1, 2008
20.71
+1.661
8.72%
jan 1, 2009
31.583
+10.873
52.5%
jan 1, 2010
24.241
-7.341
-23.25%
jan 1, 2011
24.95
+0.709
2.92%
jan 1, 2012
27.928
+2.978
11.93%
jan 1, 2013
35.818
+7.891
28.25%
jan 1, 2014
37.199
+1.381
3.85%
jan 1, 2015
31.789
-5.41
-14.54%
jan 1, 2016
34.681
+2.892
9.1%
Ranking of countries by current statistics by years


Comments: