29
/
en
AIzaSyAYiBZKx7MnpbEhh9jyipgxe19OcubqV5w
April 1, 2024
45760
Low & middle income
LMY
false
2
1
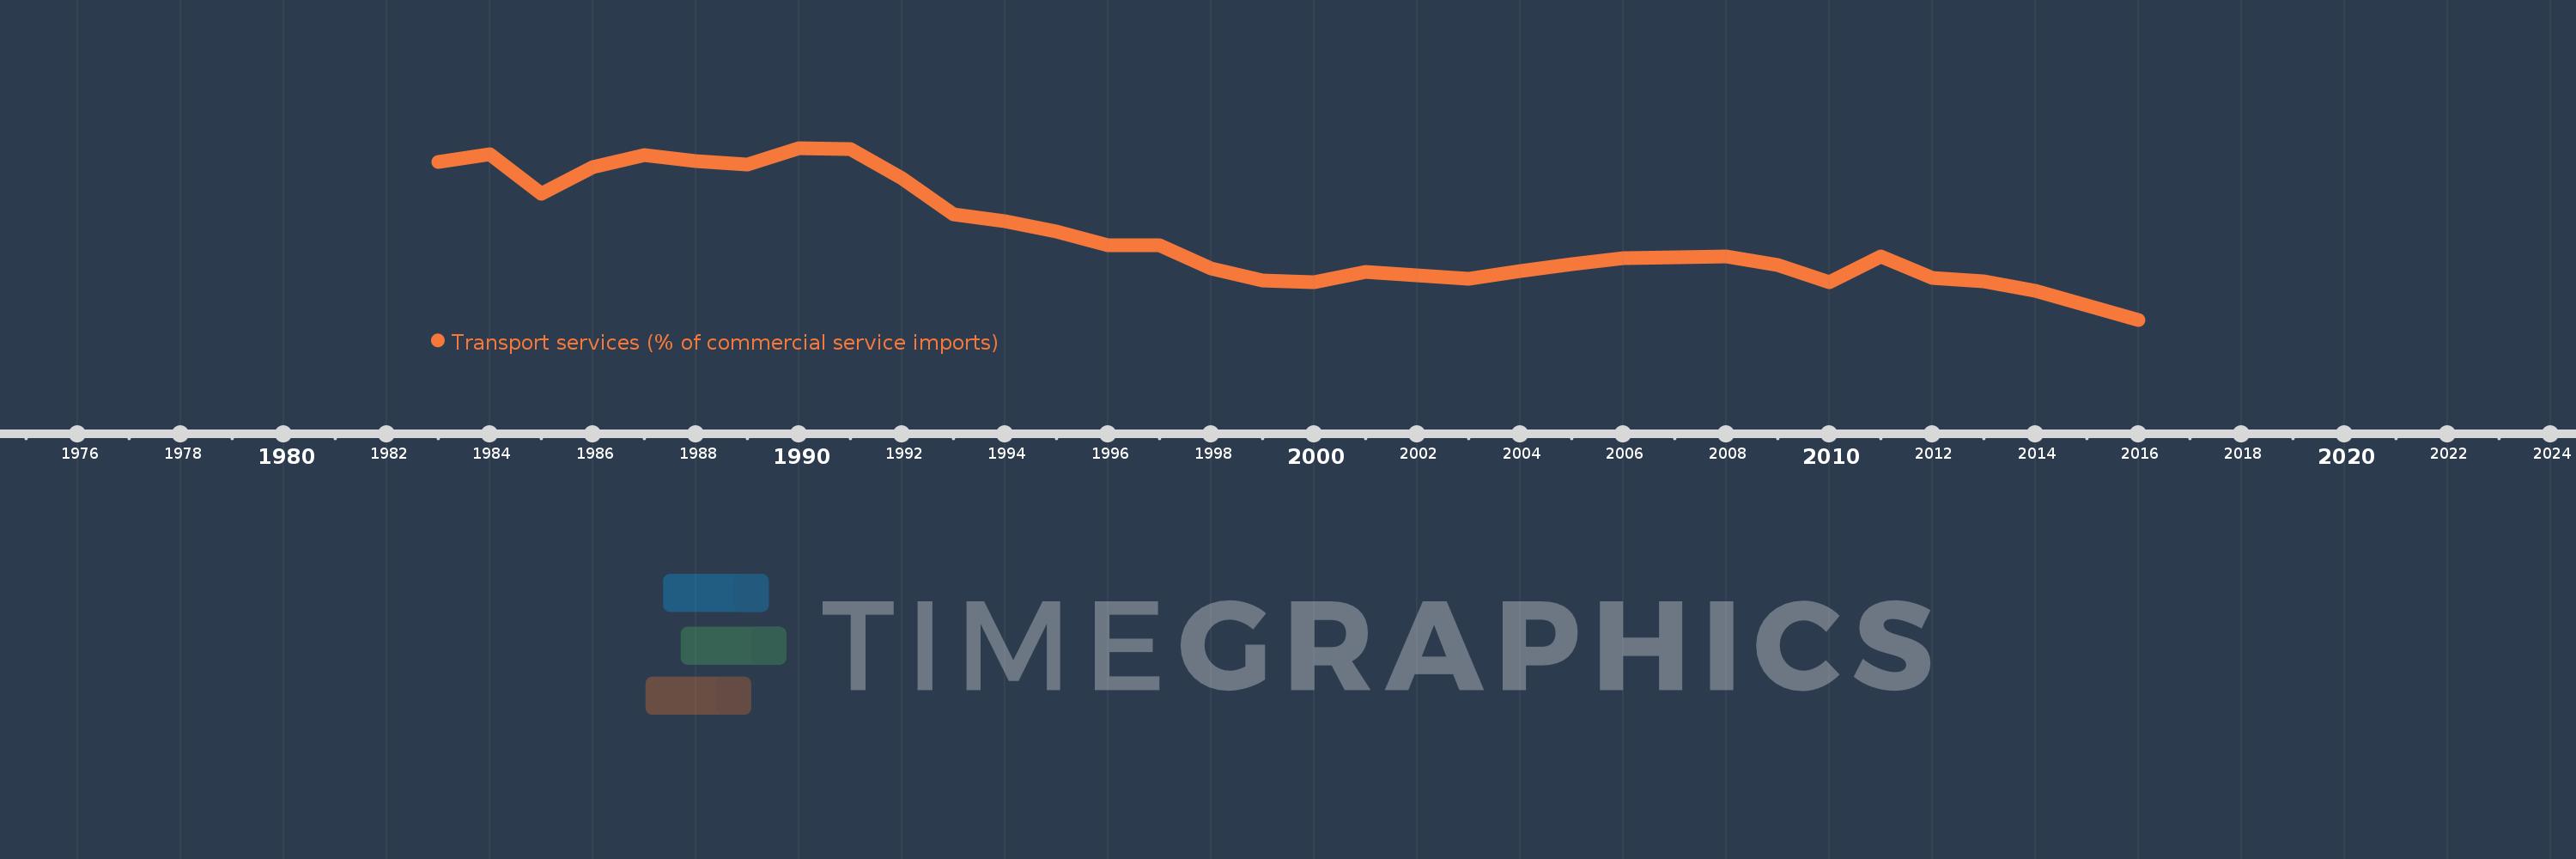
Transport services (% of commercial service imports)
2016,2015,2014,2013,2012,2011,2010,2009,2008,2007,2006,2005,2004,2003,2002,2001,2000,1999,1998,1997,1996,1995,1994,1993,1992,1991,1990,1989,1988,1987,1986,1985,1984,1983
This statistics in other country:
AfghanistanAlbaniaAlgeriaAngolaAntigua and BarbudaArab WorldArgentinaArmeniaArubaAustraliaAustriaAzerbaijanBahamas, TheBahrainBangladeshBarbadosBelarusBelgiumBelizeBeninBermudaBhutanBoliviaBosnia and HerzegovinaBotswanaBrazilBrunei DarussalamBulgariaBurkina FasoBurundiCabo VerdeCambodiaCameroonCanadaCaribbean small statesCentral African RepublicCentral Europe and the BalticsChadChileChinaColombiaComorosCongo, Dem. Rep.Congo, Rep.Costa RicaCote d'IvoireCroatiaCuracaoCyprusCzech RepublicDenmarkDjiboutiDominicaDominican RepublicEarly-demographic dividendEast Asia & PacificEast Asia & Pacific (excluding high income)East Asia & Pacific (IDA & IBRD countries)EcuadorEgypt, Arab Rep.El SalvadorEquatorial GuineaEritreaEstoniaEthiopiaEuro areaEurope & Central AsiaEurope & Central Asia (excluding high income)Europe & Central Asia (IDA & IBRD countries)European UnionFaroe IslandsFijiFinlandFragile and conflict affected situationsFranceFrench PolynesiaGabonGambia, TheGeorgiaGermanyGhanaGreeceGrenadaGuatemalaGuineaGuinea-BissauGuyanaHaitiHeavily indebted poor countries (HIPC)High incomeHondurasHong Kong SAR, ChinaHungaryIBRD onlyIcelandIDA & IBRD totalIDA onlyIDA totalIndiaIndonesiaIran, Islamic Rep.IraqIrelandIsraelItalyJamaicaJapanJordanKazakhstanKenyaKiribatiKorea, Rep.KosovoKuwaitKyrgyz RepublicLao PDRLate-demographic dividendLatin America & Caribbean Latin America & Caribbean (excluding high income)Latin America & the Caribbean (IDA & IBRD countries)LatviaLeast developed countries: UN classificationLebanonLesothoLiberiaLibyaLithuaniaLow & middle incomeLow incomeLower middle incomeLuxembourgMacao SAR, ChinaMacedonia, FYRMadagascarMalawiMalaysiaMaldivesMaliMaltaMarshall IslandsMauritaniaMauritiusMexicoMicronesia, Fed. Sts.Middle East & North AfricaMiddle East & North Africa (excluding high income)Middle East & North Africa (IDA & IBRD countries)Middle incomeMoldovaMongoliaMontenegroMoroccoMozambiqueMyanmarNamibiaNepalNetherlandsNew CaledoniaNew ZealandNicaraguaNigerNigeriaNorth AmericaNorwayOECD membersOmanOther small statesPacific island small statesPakistanPalauPanamaPapua New GuineaParaguayPeruPhilippinesPolandPortugalPost-demographic dividendPre-demographic dividendQatarRomaniaRussian FederationRwandaSamoaSao Tome and PrincipeSaudi ArabiaSenegalSerbiaSeychellesSierra LeoneSingaporeSint Maarten (Dutch part)Slovak RepublicSloveniaSmall statesSolomon IslandsSouth AfricaSouth AsiaSouth Asia (IDA & IBRD)South SudanSpainSri LankaSt. Kitts and NevisSt. LuciaSt. Vincent and the GrenadinesSub-Saharan Africa Sub-Saharan Africa (excluding high income)Sub-Saharan Africa (IDA & IBRD countries)SudanSurinameSwazilandSwedenSwitzerlandSyrian Arab RepublicTajikistanTanzaniaThailandTimor-LesteTogoTongaTrinidad and TobagoTunisiaTurkeyTuvaluUgandaUkraineUnited KingdomUnited StatesUpper middle incomeUruguayVanuatuVenezuela, RBWest Bank and GazaWorldYemen, Rep.ZambiaZimbabwe Timeline:
This timeline shows a graph from 1983 to 2016 of Low & middle income. No data until 1982. Number of actual observations by date: 34.
Source name:
World Development Indicators
Source organization:
International Monetary Fund, Balance of Payments Statistics Yearbook and data files.
Categories, topics:
Private Sector, Trade
Last updated:
apr 23, 2017
Indicators value changes by year
Minimum:
25.729
jan 1, 2016
Maximum:
57.762
jan 1, 1990
At the date of observation
Value
Absolute change
Change from previous value
jan 1, 1983
55.093
+55.093
0.0%
jan 1, 1984
56.616
+1.523
2.77%
jan 1, 1985
49.266
-7.35
-12.98%
jan 1, 1986
54.174
+4.908
9.96%
jan 1, 1987
56.376
+2.202
4.06%
jan 1, 1988
55.333
-1.043
-1.85%
jan 1, 1989
54.647
-0.686
-1.24%
jan 1, 1990
57.762
+3.115
5.7%
jan 1, 1991
57.507
-0.254
-0.44%
jan 1, 1992
52.048
-5.459
-9.49%
jan 1, 1993
45.456
-6.592
-12.67%
jan 1, 1994
44.166
-1.29
-2.84%
jan 1, 1995
42.106
-2.06
-4.66%
jan 1, 1996
39.545
-2.562
-6.08%
jan 1, 1997
39.68
+0.136
0.34%
jan 1, 1998
35.269
-4.411
-11.12%
jan 1, 1999
33.128
-2.141
-6.07%
jan 1, 2000
32.706
-0.422
-1.28%
jan 1, 2001
34.638
+1.932
5.91%
jan 1, 2002
33.978
-0.661
-1.91%
jan 1, 2003
33.426
-0.551
-1.62%
jan 1, 2004
34.784
+1.358
4.06%
jan 1, 2005
36.16
+1.375
3.95%
jan 1, 2006
37.234
+1.075
2.97%
jan 1, 2007
37.318
+0.084
0.23%
jan 1, 2008
37.538
+0.219
0.59%
jan 1, 2009
35.996
-1.541
-4.11%
jan 1, 2010
32.686
-3.31
-9.2%
jan 1, 2011
37.463
+4.777
14.61%
jan 1, 2012
33.577
-3.886
-10.37%
jan 1, 2013
32.817
-0.759
-2.26%
jan 1, 2014
31.111
-1.707
-5.2%
jan 1, 2015
28.481
-2.63
-8.45%
jan 1, 2016
25.729
-2.752
-9.66%
Ranking of countries by current statistics by years


Comments: