29
/
en
AIzaSyAYiBZKx7MnpbEhh9jyipgxe19OcubqV5w
April 1, 2024
251490
St. Lucia
LCA
true
2
1
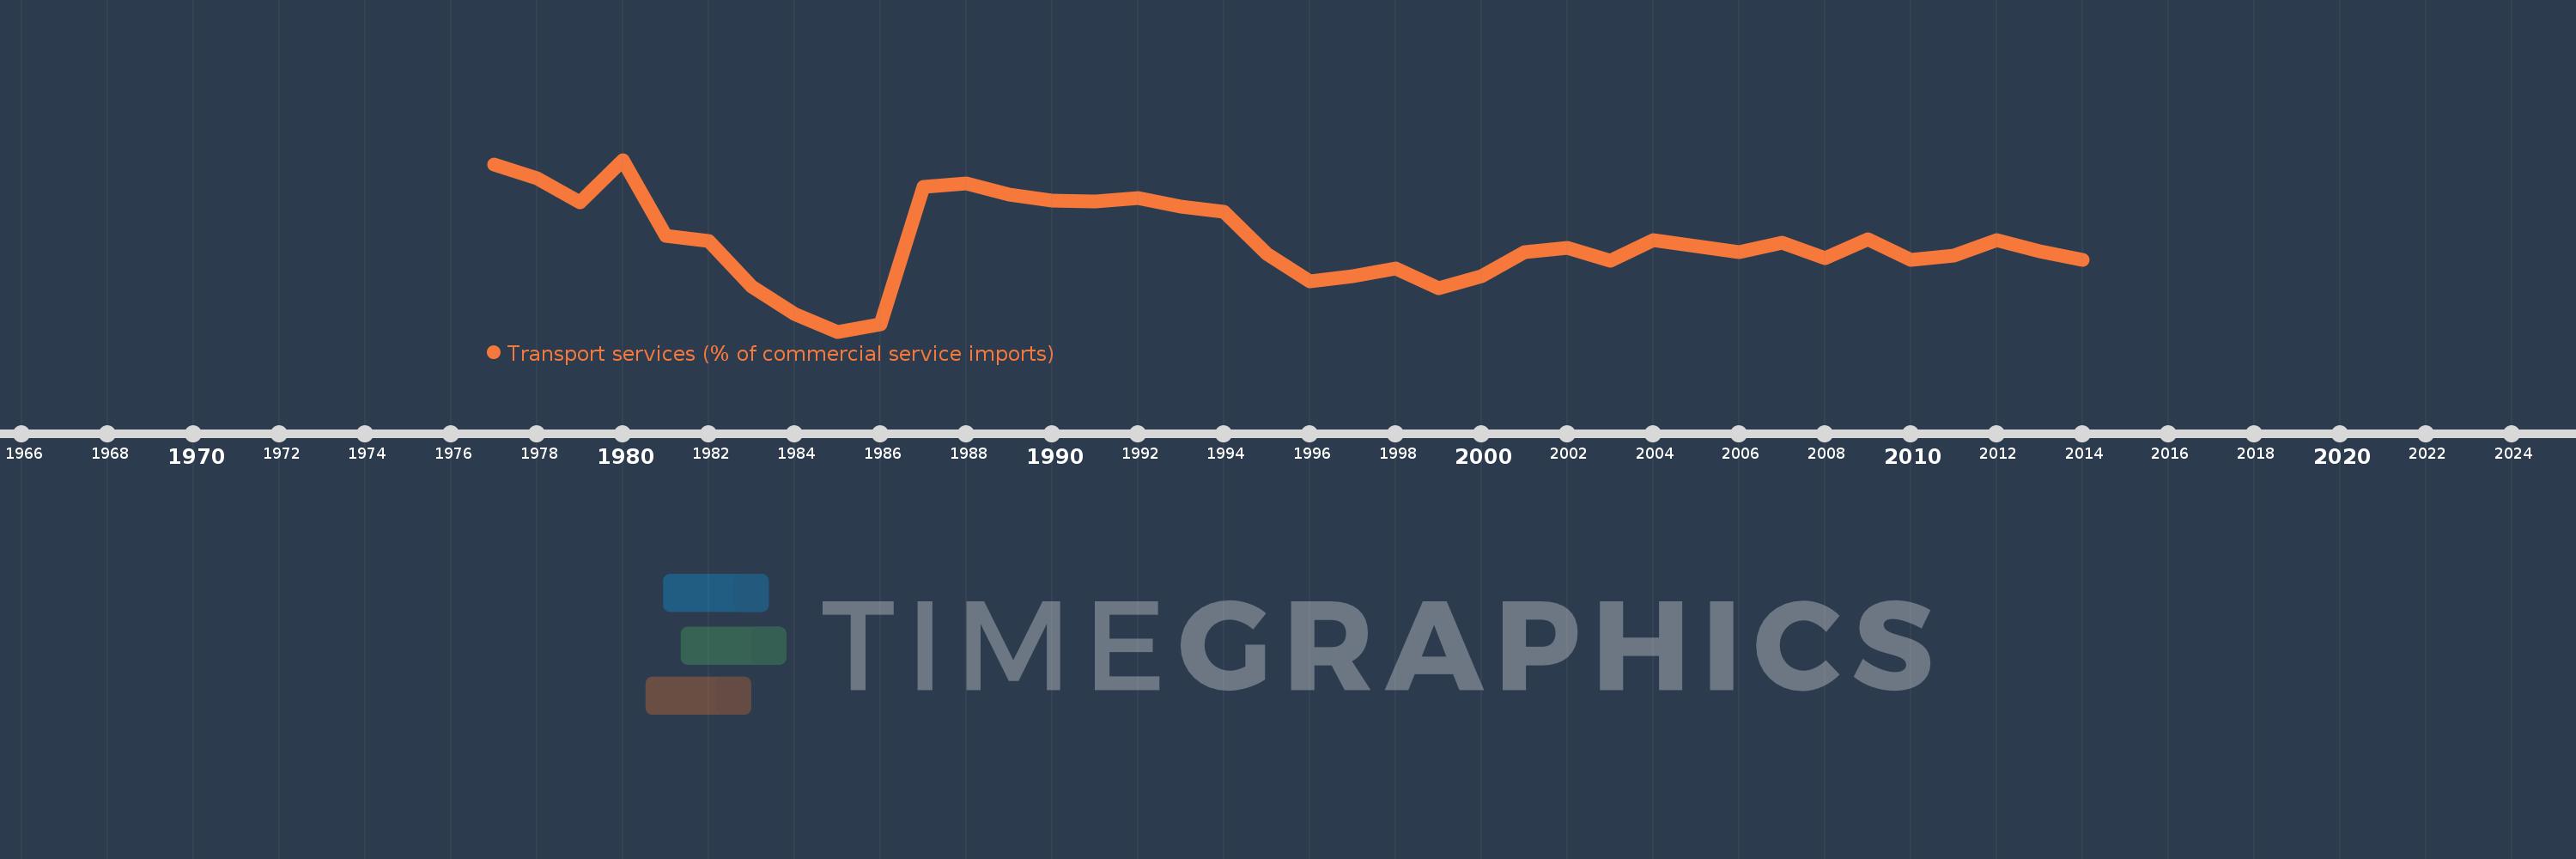
Transport services (% of commercial service imports)
2014,2013,2012,2011,2010,2009,2008,2007,2006,2005,2004,2003,2002,2001,2000,1999,1998,1997,1996,1995,1994,1993,1992,1991,1990,1989,1988,1987,1986,1985,1984,1983,1982,1981,1980,1979,1978,1977
This statistics in other country:
AfghanistanAlbaniaAlgeriaAngolaAntigua and BarbudaArab WorldArgentinaArmeniaArubaAustraliaAustriaAzerbaijanBahamas, TheBahrainBangladeshBarbadosBelarusBelgiumBelizeBeninBermudaBhutanBoliviaBosnia and HerzegovinaBotswanaBrazilBrunei DarussalamBulgariaBurkina FasoBurundiCabo VerdeCambodiaCameroonCanadaCaribbean small statesCentral African RepublicCentral Europe and the BalticsChadChileChinaColombiaComorosCongo, Dem. Rep.Congo, Rep.Costa RicaCote d'IvoireCroatiaCuracaoCyprusCzech RepublicDenmarkDjiboutiDominicaDominican RepublicEarly-demographic dividendEast Asia & PacificEast Asia & Pacific (excluding high income)East Asia & Pacific (IDA & IBRD countries)EcuadorEgypt, Arab Rep.El SalvadorEquatorial GuineaEritreaEstoniaEthiopiaEuro areaEurope & Central AsiaEurope & Central Asia (excluding high income)Europe & Central Asia (IDA & IBRD countries)European UnionFaroe IslandsFijiFinlandFragile and conflict affected situationsFranceFrench PolynesiaGabonGambia, TheGeorgiaGermanyGhanaGreeceGrenadaGuatemalaGuineaGuinea-BissauGuyanaHaitiHeavily indebted poor countries (HIPC)High incomeHondurasHong Kong SAR, ChinaHungaryIBRD onlyIcelandIDA & IBRD totalIDA onlyIDA totalIndiaIndonesiaIran, Islamic Rep.IraqIrelandIsraelItalyJamaicaJapanJordanKazakhstanKenyaKiribatiKorea, Rep.KosovoKuwaitKyrgyz RepublicLao PDRLate-demographic dividendLatin America & Caribbean Latin America & Caribbean (excluding high income)Latin America & the Caribbean (IDA & IBRD countries)LatviaLeast developed countries: UN classificationLebanonLesothoLiberiaLibyaLithuaniaLow & middle incomeLow incomeLower middle incomeLuxembourgMacao SAR, ChinaMacedonia, FYRMadagascarMalawiMalaysiaMaldivesMaliMaltaMarshall IslandsMauritaniaMauritiusMexicoMicronesia, Fed. Sts.Middle East & North AfricaMiddle East & North Africa (excluding high income)Middle East & North Africa (IDA & IBRD countries)Middle incomeMoldovaMongoliaMontenegroMoroccoMozambiqueMyanmarNamibiaNepalNetherlandsNew CaledoniaNew ZealandNicaraguaNigerNigeriaNorth AmericaNorwayOECD membersOmanOther small statesPacific island small statesPakistanPalauPanamaPapua New GuineaParaguayPeruPhilippinesPolandPortugalPost-demographic dividendPre-demographic dividendQatarRomaniaRussian FederationRwandaSamoaSao Tome and PrincipeSaudi ArabiaSenegalSerbiaSeychellesSierra LeoneSingaporeSint Maarten (Dutch part)Slovak RepublicSloveniaSmall statesSolomon IslandsSouth AfricaSouth AsiaSouth Asia (IDA & IBRD)South SudanSpainSri LankaSt. Kitts and NevisSt. LuciaSt. Vincent and the GrenadinesSub-Saharan Africa Sub-Saharan Africa (excluding high income)Sub-Saharan Africa (IDA & IBRD countries)SudanSurinameSwazilandSwedenSwitzerlandSyrian Arab RepublicTajikistanTanzaniaThailandTimor-LesteTogoTongaTrinidad and TobagoTunisiaTurkeyTuvaluUgandaUkraineUnited KingdomUnited StatesUpper middle incomeUruguayVanuatuVenezuela, RBWest Bank and GazaWorldYemen, Rep.ZambiaZimbabwe Timeline:
This timeline shows a graph from 1977 to 2014 of St. Lucia. No data until 1976. Number of actual observations by date: 38.
Source name:
World Development Indicators
Source organization:
International Monetary Fund, Balance of Payments Statistics Yearbook and data files.
Categories, topics:
Private Sector, Trade
Last updated:
apr 23, 2017
Indicators value changes by year
Minimum:
25.354
jan 1, 1985
Maximum:
61.807
jan 1, 1980
At the date of observation
Value
Absolute change
Change from previous value
jan 1, 1977
60.763
+60.763
0.0%
jan 1, 1978
57.843
-2.92
-4.81%
jan 1, 1979
52.831
-5.012
-8.66%
jan 1, 1980
61.807
+8.975
16.99%
jan 1, 1981
45.715
-16.092
-26.04%
jan 1, 1982
44.668
-1.046
-2.29%
jan 1, 1983
34.861
-9.807
-21.96%
jan 1, 1984
29.138
-5.724
-16.42%
jan 1, 1985
25.354
-3.784
-12.99%
jan 1, 1986
26.957
+1.603
6.32%
jan 1, 1987
56.011
+29.054
107.78%
jan 1, 1988
56.808
+0.797
1.42%
jan 1, 1989
54.379
-2.429
-4.28%
jan 1, 1990
53.161
-1.218
-2.24%
jan 1, 1991
52.918
-0.243
-0.46%
jan 1, 1992
53.767
+0.848
1.6%
jan 1, 1993
51.863
-1.904
-3.54%
jan 1, 1994
50.689
-1.174
-2.26%
jan 1, 1995
41.901
-8.788
-17.34%
jan 1, 1996
35.94
-5.961
-14.23%
jan 1, 1997
37.16
+1.22
3.39%
jan 1, 1998
38.756
+1.595
4.29%
jan 1, 1999
34.638
-4.118
-10.63%
jan 1, 2000
37.194
+2.556
7.38%
jan 1, 2001
42.16
+4.966
13.35%
jan 1, 2002
43.192
+1.033
2.45%
jan 1, 2003
40.335
-2.858
-6.62%
jan 1, 2004
44.704
+4.37
10.83%
jan 1, 2005
43.405
-1.299
-2.91%
jan 1, 2006
42.219
-1.186
-2.73%
jan 1, 2007
44.213
+1.993
4.72%
jan 1, 2008
40.854
-3.358
-7.6%
jan 1, 2009
44.898
+4.043
9.9%
jan 1, 2010
40.538
-4.36
-9.71%
jan 1, 2011
41.5
+0.962
2.37%
jan 1, 2012
44.766
+3.266
7.87%
jan 1, 2013
42.393
-2.372
-5.3%
jan 1, 2014
40.558
-1.835
-4.33%
Ranking of countries by current statistics by years


Comments: