29
/
en
AIzaSyAYiBZKx7MnpbEhh9jyipgxe19OcubqV5w
April 1, 2024
101677
Canada
CAN
true
2
1
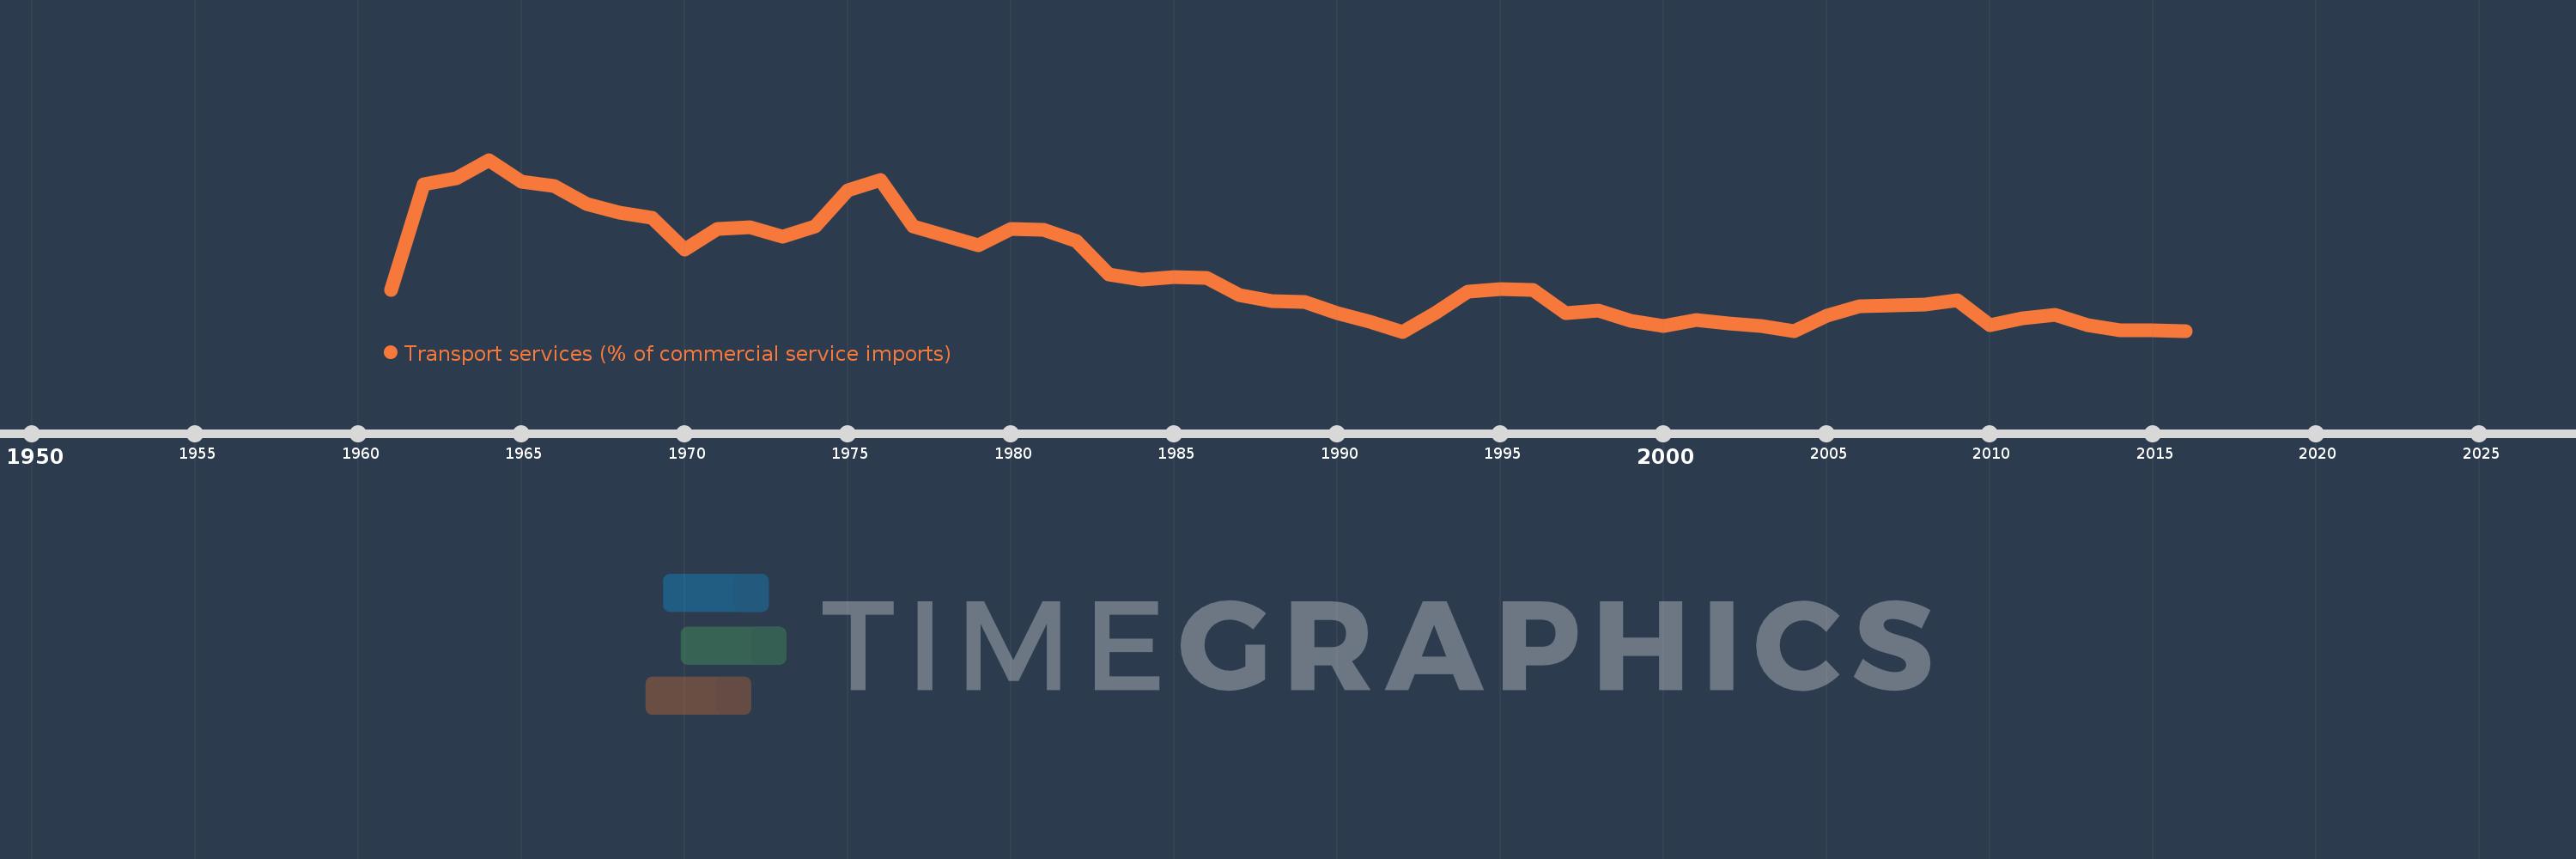
Transport services (% of commercial service imports)
2016,2015,2014,2013,2012,2011,2010,2009,2008,2007,2006,2005,2004,2003,2002,2001,2000,1999,1998,1997,1996,1995,1994,1993,1992,1991,1990,1989,1988,1987,1986,1985,1984,1983,1982,1981,1980,1979,1978,1977,1976,1975,1974,1973,1972,1971,1970,1969,1968,1967,1966,1965,1964,1963,1962,1961
This statistics in other country:
AfghanistanAlbaniaAlgeriaAngolaAntigua and BarbudaArab WorldArgentinaArmeniaArubaAustraliaAustriaAzerbaijanBahamas, TheBahrainBangladeshBarbadosBelarusBelgiumBelizeBeninBermudaBhutanBoliviaBosnia and HerzegovinaBotswanaBrazilBrunei DarussalamBulgariaBurkina FasoBurundiCabo VerdeCambodiaCameroonCanadaCaribbean small statesCentral African RepublicCentral Europe and the BalticsChadChileChinaColombiaComorosCongo, Dem. Rep.Congo, Rep.Costa RicaCote d'IvoireCroatiaCuracaoCyprusCzech RepublicDenmarkDjiboutiDominicaDominican RepublicEarly-demographic dividendEast Asia & PacificEast Asia & Pacific (excluding high income)East Asia & Pacific (IDA & IBRD countries)EcuadorEgypt, Arab Rep.El SalvadorEquatorial GuineaEritreaEstoniaEthiopiaEuro areaEurope & Central AsiaEurope & Central Asia (excluding high income)Europe & Central Asia (IDA & IBRD countries)European UnionFaroe IslandsFijiFinlandFragile and conflict affected situationsFranceFrench PolynesiaGabonGambia, TheGeorgiaGermanyGhanaGreeceGrenadaGuatemalaGuineaGuinea-BissauGuyanaHaitiHeavily indebted poor countries (HIPC)High incomeHondurasHong Kong SAR, ChinaHungaryIBRD onlyIcelandIDA & IBRD totalIDA onlyIDA totalIndiaIndonesiaIran, Islamic Rep.IraqIrelandIsraelItalyJamaicaJapanJordanKazakhstanKenyaKiribatiKorea, Rep.KosovoKuwaitKyrgyz RepublicLao PDRLate-demographic dividendLatin America & Caribbean Latin America & Caribbean (excluding high income)Latin America & the Caribbean (IDA & IBRD countries)LatviaLeast developed countries: UN classificationLebanonLesothoLiberiaLibyaLithuaniaLow & middle incomeLow incomeLower middle incomeLuxembourgMacao SAR, ChinaMacedonia, FYRMadagascarMalawiMalaysiaMaldivesMaliMaltaMarshall IslandsMauritaniaMauritiusMexicoMicronesia, Fed. Sts.Middle East & North AfricaMiddle East & North Africa (excluding high income)Middle East & North Africa (IDA & IBRD countries)Middle incomeMoldovaMongoliaMontenegroMoroccoMozambiqueMyanmarNamibiaNepalNetherlandsNew CaledoniaNew ZealandNicaraguaNigerNigeriaNorth AmericaNorwayOECD membersOmanOther small statesPacific island small statesPakistanPalauPanamaPapua New GuineaParaguayPeruPhilippinesPolandPortugalPost-demographic dividendPre-demographic dividendQatarRomaniaRussian FederationRwandaSamoaSao Tome and PrincipeSaudi ArabiaSenegalSerbiaSeychellesSierra LeoneSingaporeSint Maarten (Dutch part)Slovak RepublicSloveniaSmall statesSolomon IslandsSouth AfricaSouth AsiaSouth Asia (IDA & IBRD)South SudanSpainSri LankaSt. Kitts and NevisSt. LuciaSt. Vincent and the GrenadinesSub-Saharan Africa Sub-Saharan Africa (excluding high income)Sub-Saharan Africa (IDA & IBRD countries)SudanSurinameSwazilandSwedenSwitzerlandSyrian Arab RepublicTajikistanTanzaniaThailandTimor-LesteTogoTongaTrinidad and TobagoTunisiaTurkeyTuvaluUgandaUkraineUnited KingdomUnited StatesUpper middle incomeUruguayVanuatuVenezuela, RBWest Bank and GazaWorldYemen, Rep.ZambiaZimbabwe Timeline:
This timeline shows a graph from 1961 to 2016 of Canada. No data until 1960. Number of actual observations by date: 56.
Source name:
World Development Indicators
Source organization:
International Monetary Fund, Balance of Payments Statistics Yearbook and data files.
Categories, topics:
Private Sector, Trade
Last updated:
apr 23, 2017
Indicators value changes by year
Minimum:
20.779
jan 1, 1992
Maximum:
38.954
jan 1, 1964
At the date of observation
Value
Absolute change
Change from previous value
jan 1, 1961
25.229
+25.229
0.0%
jan 1, 1962
36.328
+11.098
43.99%
jan 1, 1963
37.005
+0.678
1.87%
jan 1, 1964
38.954
+1.949
5.27%
jan 1, 1965
36.673
-2.282
-5.86%
jan 1, 1966
36.144
-0.529
-1.44%
jan 1, 1967
34.261
-1.883
-5.21%
jan 1, 1968
33.409
-0.853
-2.49%
jan 1, 1969
32.835
-0.574
-1.72%
jan 1, 1970
29.429
-3.406
-10.37%
jan 1, 1971
31.645
+2.216
7.53%
jan 1, 1972
31.843
+0.198
0.63%
jan 1, 1973
30.836
-1.007
-3.16%
jan 1, 1974
31.92
+1.084
3.52%
jan 1, 1975
35.771
+3.851
12.07%
jan 1, 1976
36.779
+1.008
2.82%
jan 1, 1977
31.921
-4.858
-13.21%
jan 1, 1978
30.902
-1.02
-3.19%
jan 1, 1979
29.939
-0.962
-3.11%
jan 1, 1980
31.625
+1.685
5.63%
jan 1, 1981
31.529
-0.096
-0.3%
jan 1, 1982
30.397
-1.131
-3.59%
jan 1, 1983
26.852
-3.545
-11.66%
jan 1, 1984
26.283
-0.57
-2.12%
jan 1, 1985
26.567
+0.285
1.08%
jan 1, 1986
26.463
-0.105
-0.39%
jan 1, 1987
24.646
-1.816
-6.86%
jan 1, 1988
24.043
-0.604
-2.45%
jan 1, 1989
23.95
-0.093
-0.39%
jan 1, 1990
22.752
-1.198
-5.0%
jan 1, 1991
21.851
-0.901
-3.96%
jan 1, 1992
20.779
-1.072
-4.9%
jan 1, 1993
22.757
+1.978
9.52%
jan 1, 1994
25.005
+2.248
9.88%
jan 1, 1995
25.301
+0.295
1.18%
jan 1, 1996
25.17
-0.13
-0.52%
jan 1, 1997
22.718
-2.452
-9.74%
jan 1, 1998
23.021
+0.303
1.34%
jan 1, 1999
21.946
-1.075
-4.67%
jan 1, 2000
21.366
-0.579
-2.64%
jan 1, 2001
22.017
+0.651
3.05%
jan 1, 2002
21.685
-0.332
-1.51%
jan 1, 2003
21.374
-0.311
-1.43%
jan 1, 2004
20.824
-0.55
-2.57%
jan 1, 2005
22.491
+1.667
8.01%
jan 1, 2006
23.476
+0.985
4.38%
jan 1, 2007
23.557
+0.081
0.35%
jan 1, 2008
23.649
+0.092
0.39%
jan 1, 2009
24.06
+0.411
1.74%
jan 1, 2010
21.471
-2.589
-10.76%
jan 1, 2011
22.176
+0.705
3.28%
jan 1, 2012
22.577
+0.401
1.81%
jan 1, 2013
21.477
-1.1
-4.87%
jan 1, 2014
20.946
-0.531
-2.47%
jan 1, 2015
20.954
+0.008
0.04%
jan 1, 2016
20.838
-0.116
-0.55%
Ranking of countries by current statistics by years


Comments: