29
/
en
AIzaSyAYiBZKx7MnpbEhh9jyipgxe19OcubqV5w
April 1, 2024
253767
Sudan
SDN
true
2
1
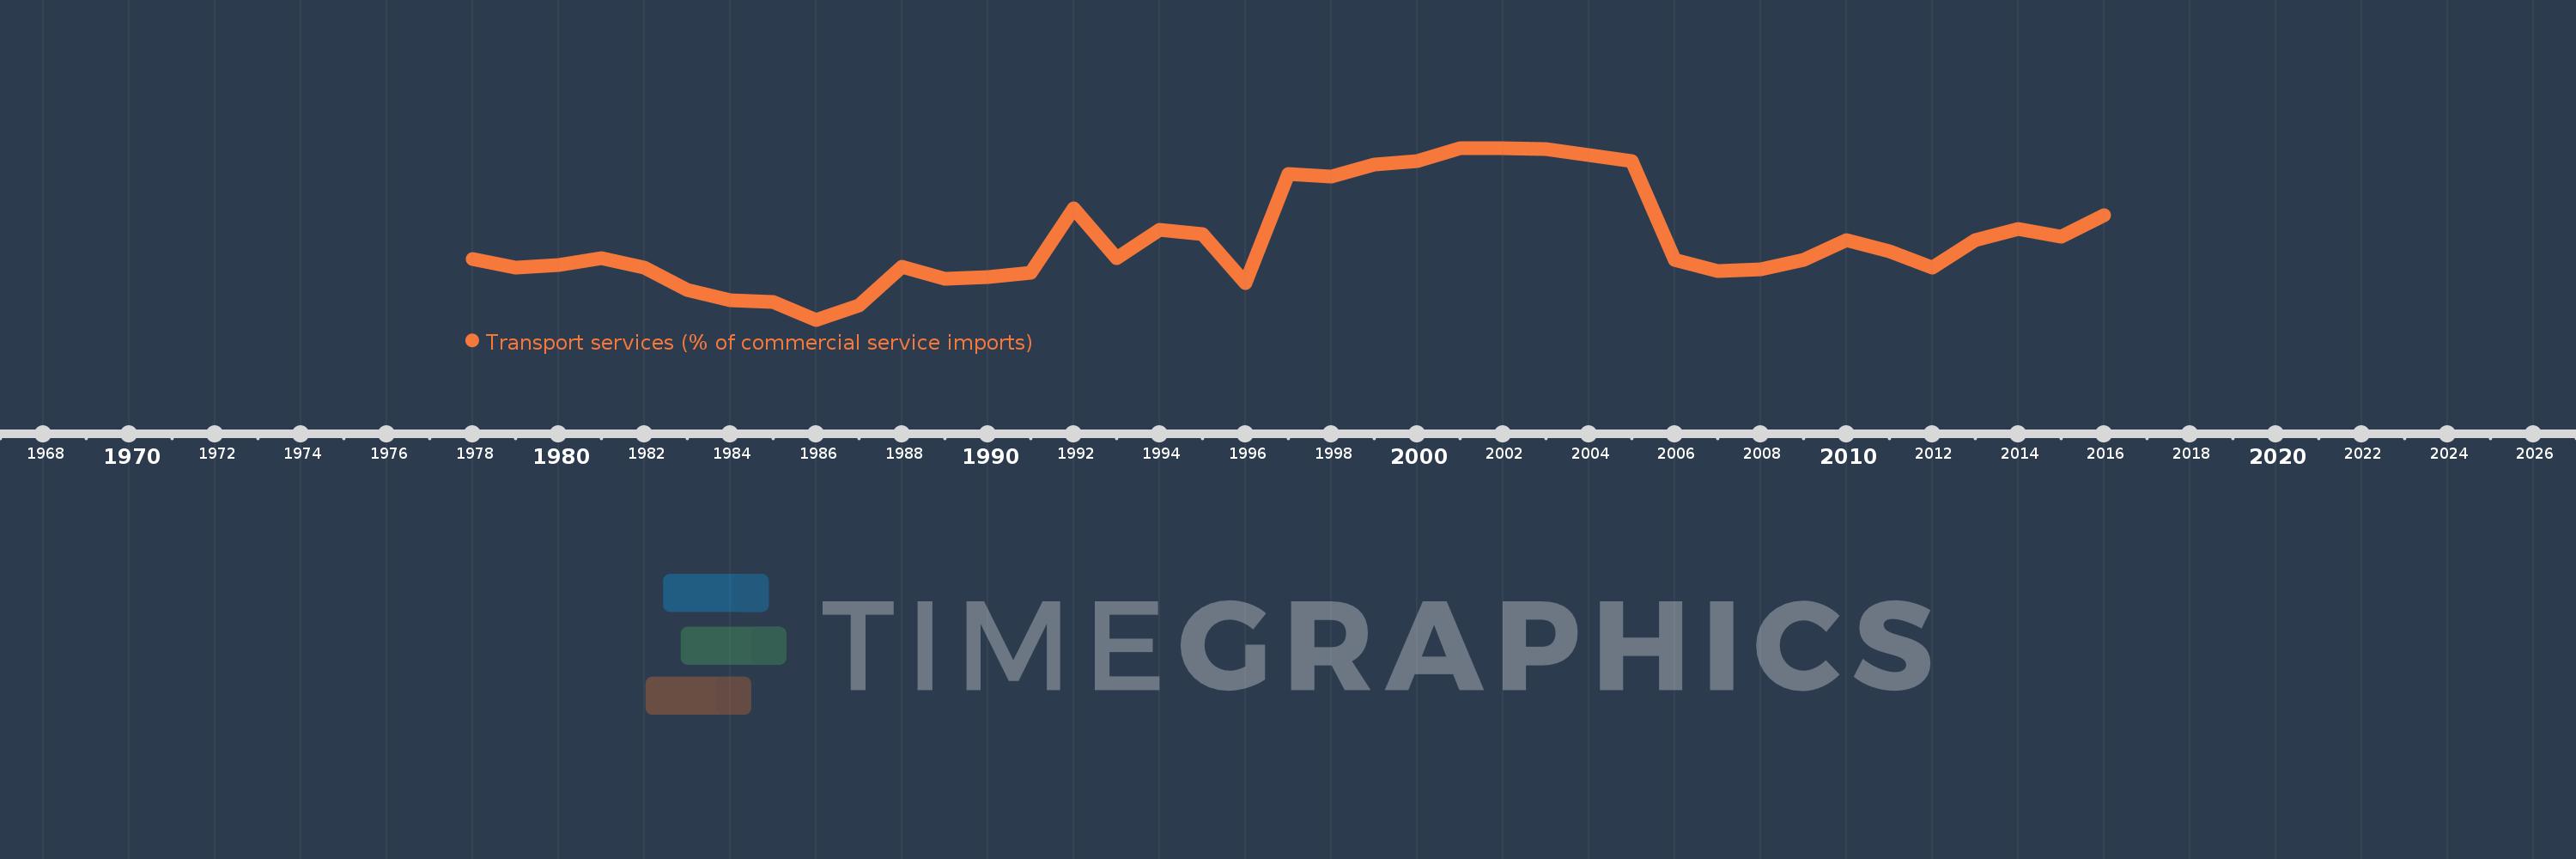
Transport services (% of commercial service imports)
2016,2015,2014,2013,2012,2011,2010,2009,2008,2007,2006,2005,2004,2003,2002,2001,2000,1999,1998,1997,1996,1995,1994,1993,1992,1991,1990,1989,1988,1987,1986,1985,1984,1983,1982,1981,1980,1979,1978
This statistics in other country:
AfghanistanAlbaniaAlgeriaAngolaAntigua and BarbudaArab WorldArgentinaArmeniaArubaAustraliaAustriaAzerbaijanBahamas, TheBahrainBangladeshBarbadosBelarusBelgiumBelizeBeninBermudaBhutanBoliviaBosnia and HerzegovinaBotswanaBrazilBrunei DarussalamBulgariaBurkina FasoBurundiCabo VerdeCambodiaCameroonCanadaCaribbean small statesCentral African RepublicCentral Europe and the BalticsChadChileChinaColombiaComorosCongo, Dem. Rep.Congo, Rep.Costa RicaCote d'IvoireCroatiaCuracaoCyprusCzech RepublicDenmarkDjiboutiDominicaDominican RepublicEarly-demographic dividendEast Asia & PacificEast Asia & Pacific (excluding high income)East Asia & Pacific (IDA & IBRD countries)EcuadorEgypt, Arab Rep.El SalvadorEquatorial GuineaEritreaEstoniaEthiopiaEuro areaEurope & Central AsiaEurope & Central Asia (excluding high income)Europe & Central Asia (IDA & IBRD countries)European UnionFaroe IslandsFijiFinlandFragile and conflict affected situationsFranceFrench PolynesiaGabonGambia, TheGeorgiaGermanyGhanaGreeceGrenadaGuatemalaGuineaGuinea-BissauGuyanaHaitiHeavily indebted poor countries (HIPC)High incomeHondurasHong Kong SAR, ChinaHungaryIBRD onlyIcelandIDA & IBRD totalIDA onlyIDA totalIndiaIndonesiaIran, Islamic Rep.IraqIrelandIsraelItalyJamaicaJapanJordanKazakhstanKenyaKiribatiKorea, Rep.KosovoKuwaitKyrgyz RepublicLao PDRLate-demographic dividendLatin America & Caribbean Latin America & Caribbean (excluding high income)Latin America & the Caribbean (IDA & IBRD countries)LatviaLeast developed countries: UN classificationLebanonLesothoLiberiaLibyaLithuaniaLow & middle incomeLow incomeLower middle incomeLuxembourgMacao SAR, ChinaMacedonia, FYRMadagascarMalawiMalaysiaMaldivesMaliMaltaMarshall IslandsMauritaniaMauritiusMexicoMicronesia, Fed. Sts.Middle East & North AfricaMiddle East & North Africa (excluding high income)Middle East & North Africa (IDA & IBRD countries)Middle incomeMoldovaMongoliaMontenegroMoroccoMozambiqueMyanmarNamibiaNepalNetherlandsNew CaledoniaNew ZealandNicaraguaNigerNigeriaNorth AmericaNorwayOECD membersOmanOther small statesPacific island small statesPakistanPalauPanamaPapua New GuineaParaguayPeruPhilippinesPolandPortugalPost-demographic dividendPre-demographic dividendQatarRomaniaRussian FederationRwandaSamoaSao Tome and PrincipeSaudi ArabiaSenegalSerbiaSeychellesSierra LeoneSingaporeSint Maarten (Dutch part)Slovak RepublicSloveniaSmall statesSolomon IslandsSouth AfricaSouth AsiaSouth Asia (IDA & IBRD)South SudanSpainSri LankaSt. Kitts and NevisSt. LuciaSt. Vincent and the GrenadinesSub-Saharan Africa Sub-Saharan Africa (excluding high income)Sub-Saharan Africa (IDA & IBRD countries)SudanSurinameSwazilandSwedenSwitzerlandSyrian Arab RepublicTajikistanTanzaniaThailandTimor-LesteTogoTongaTrinidad and TobagoTunisiaTurkeyTuvaluUgandaUkraineUnited KingdomUnited StatesUpper middle incomeUruguayVanuatuVenezuela, RBWest Bank and GazaWorldYemen, Rep.ZambiaZimbabwe Timeline:
This timeline shows a graph from 1978 to 2016 of Sudan. No data until 1977. Number of actual observations by date: 39.
Source name:
World Development Indicators
Source organization:
International Monetary Fund, Balance of Payments Statistics Yearbook and data files.
Categories, topics:
Private Sector, Trade
Last updated:
apr 23, 2017
Indicators value changes by year
Minimum:
10.976
jan 1, 1986
Maximum:
87.864
jan 1, 2001
At the date of observation
Value
Absolute change
Change from previous value
jan 1, 1978
38.095
+38.095
0.0%
jan 1, 1979
34.354
-3.74
-9.82%
jan 1, 1980
35.499
+1.145
3.33%
jan 1, 1981
38.432
+2.932
8.26%
jan 1, 1982
34.216
-4.216
-10.97%
jan 1, 1983
24.147
-10.069
-29.43%
jan 1, 1984
19.75
-4.397
-18.21%
jan 1, 1985
19.013
-0.737
-3.73%
jan 1, 1986
10.976
-8.037
-42.27%
jan 1, 1987
17.361
+6.385
58.17%
jan 1, 1988
34.759
+17.397
100.21%
jan 1, 1989
29.365
-5.394
-15.52%
jan 1, 1990
29.994
+0.629
2.14%
jan 1, 1991
31.894
+1.901
6.34%
jan 1, 1992
60.705
+28.811
90.33%
jan 1, 1993
38.477
-22.228
-36.62%
jan 1, 1994
51.048
+12.571
32.67%
jan 1, 1995
49.147
-1.901
-3.72%
jan 1, 1996
27.291
-21.856
-44.47%
jan 1, 1997
76.121
+48.83
178.93%
jan 1, 1998
75.193
-0.928
-1.22%
jan 1, 1999
80.439
+5.246
6.98%
jan 1, 2000
82.091
+1.652
2.05%
jan 1, 2001
87.864
+5.773
7.03%
jan 1, 2002
87.588
-0.276
-0.31%
jan 1, 2003
87.484
-0.104
-0.12%
jan 1, 2004
84.786
-2.699
-3.08%
jan 1, 2005
82.173
-2.613
-3.08%
jan 1, 2006
37.634
-44.539
-54.2%
jan 1, 2007
32.902
-4.731
-12.57%
jan 1, 2008
33.555
+0.653
1.99%
jan 1, 2009
37.948
+4.393
13.09%
jan 1, 2010
46.605
+8.656
22.81%
jan 1, 2011
41.743
-4.861
-10.43%
jan 1, 2012
34.389
-7.354
-17.62%
jan 1, 2013
46.51
+12.12
35.24%
jan 1, 2014
51.61
+5.1
10.97%
jan 1, 2015
48.063
-3.547
-6.87%
jan 1, 2016
57.679
+9.616
20.01%
Ranking of countries by current statistics by years


Comments: