29
/
en
AIzaSyAYiBZKx7MnpbEhh9jyipgxe19OcubqV5w
April 1, 2024
215908
Oman
OMN
true
2
1
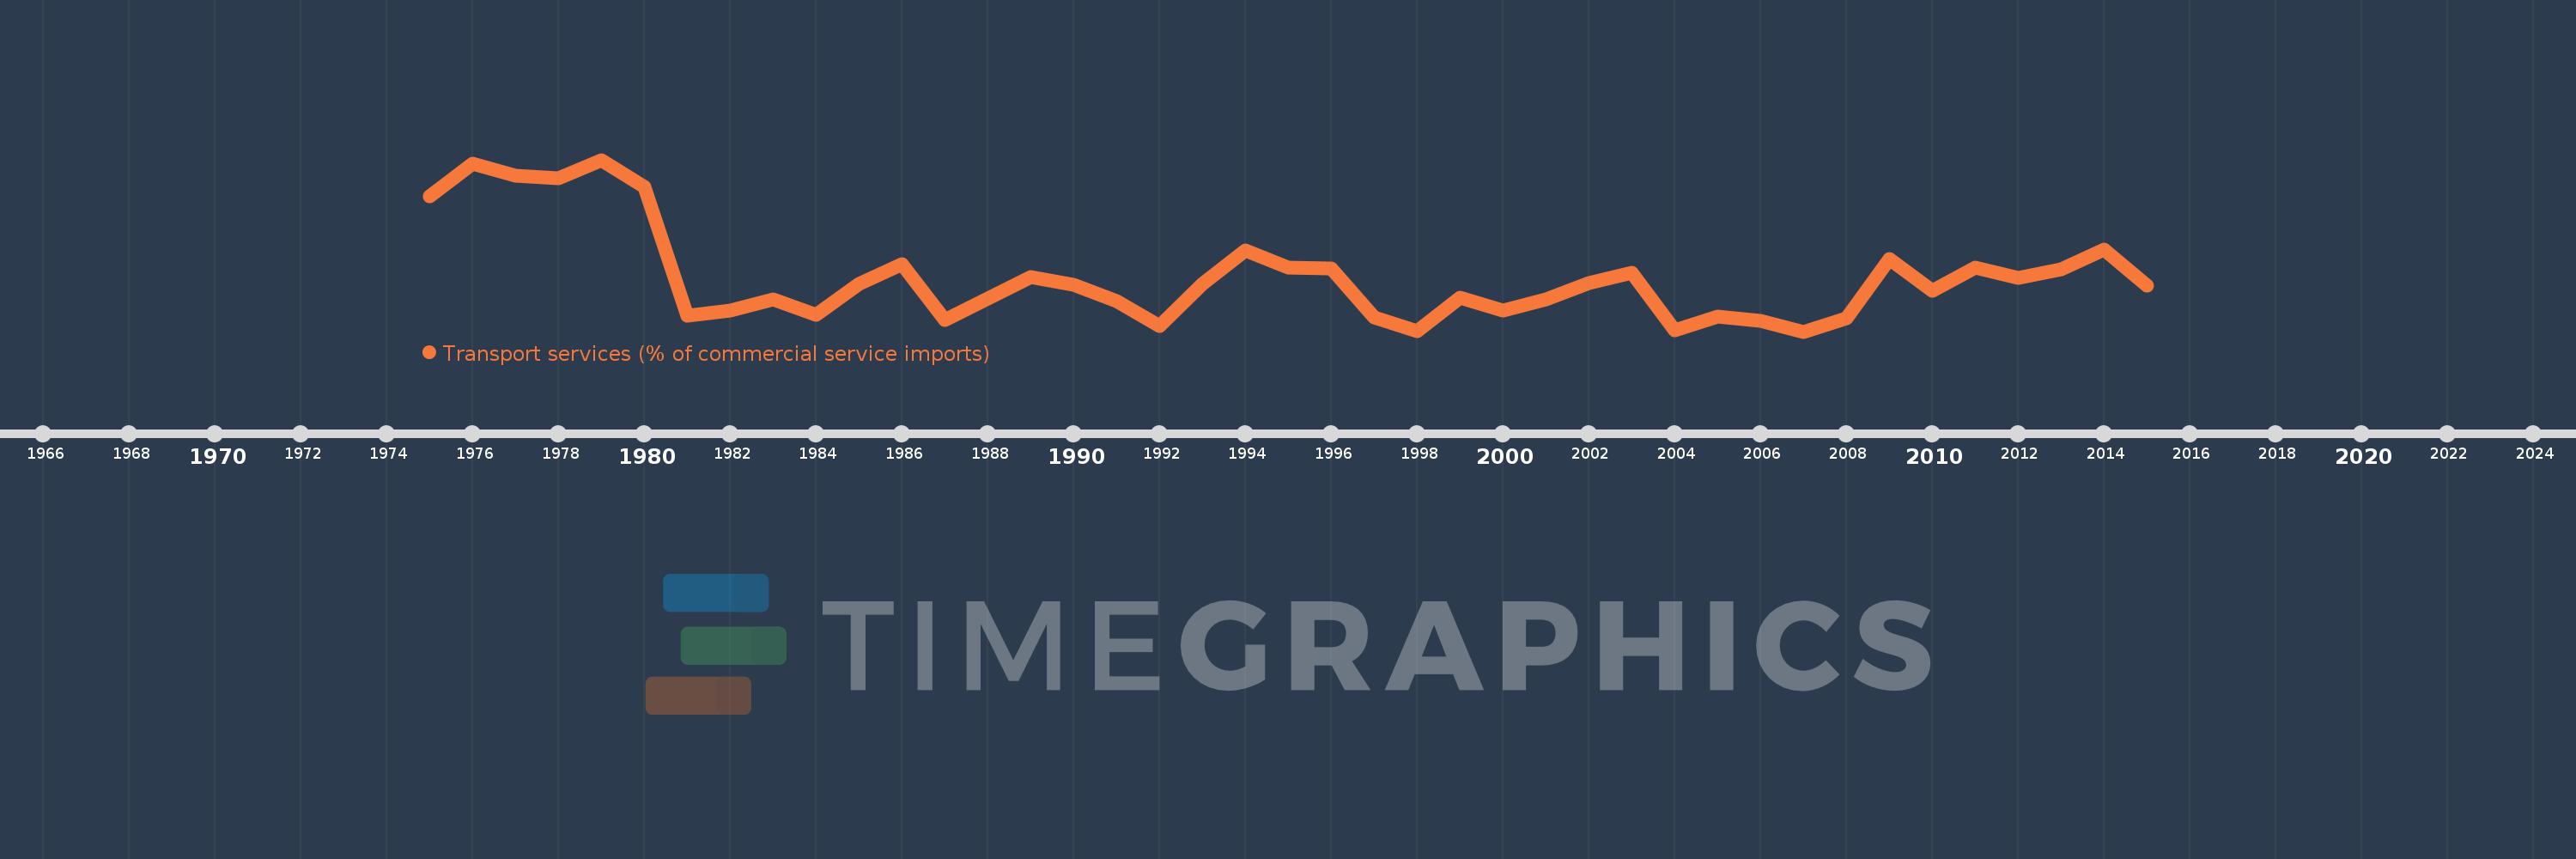
Transport services (% of commercial service imports)
2015,2014,2013,2012,2011,2010,2009,2008,2007,2006,2005,2004,2003,2002,2001,2000,1999,1998,1997,1996,1995,1994,1993,1992,1991,1990,1989,1988,1987,1986,1985,1984,1983,1982,1981,1980,1979,1978,1977,1976,1975
This statistics in other country:
AfghanistanAlbaniaAlgeriaAngolaAntigua and BarbudaArab WorldArgentinaArmeniaArubaAustraliaAustriaAzerbaijanBahamas, TheBahrainBangladeshBarbadosBelarusBelgiumBelizeBeninBermudaBhutanBoliviaBosnia and HerzegovinaBotswanaBrazilBrunei DarussalamBulgariaBurkina FasoBurundiCabo VerdeCambodiaCameroonCanadaCaribbean small statesCentral African RepublicCentral Europe and the BalticsChadChileChinaColombiaComorosCongo, Dem. Rep.Congo, Rep.Costa RicaCote d'IvoireCroatiaCuracaoCyprusCzech RepublicDenmarkDjiboutiDominicaDominican RepublicEarly-demographic dividendEast Asia & PacificEast Asia & Pacific (excluding high income)East Asia & Pacific (IDA & IBRD countries)EcuadorEgypt, Arab Rep.El SalvadorEquatorial GuineaEritreaEstoniaEthiopiaEuro areaEurope & Central AsiaEurope & Central Asia (excluding high income)Europe & Central Asia (IDA & IBRD countries)European UnionFaroe IslandsFijiFinlandFragile and conflict affected situationsFranceFrench PolynesiaGabonGambia, TheGeorgiaGermanyGhanaGreeceGrenadaGuatemalaGuineaGuinea-BissauGuyanaHaitiHeavily indebted poor countries (HIPC)High incomeHondurasHong Kong SAR, ChinaHungaryIBRD onlyIcelandIDA & IBRD totalIDA onlyIDA totalIndiaIndonesiaIran, Islamic Rep.IraqIrelandIsraelItalyJamaicaJapanJordanKazakhstanKenyaKiribatiKorea, Rep.KosovoKuwaitKyrgyz RepublicLao PDRLate-demographic dividendLatin America & Caribbean Latin America & Caribbean (excluding high income)Latin America & the Caribbean (IDA & IBRD countries)LatviaLeast developed countries: UN classificationLebanonLesothoLiberiaLibyaLithuaniaLow & middle incomeLow incomeLower middle incomeLuxembourgMacao SAR, ChinaMacedonia, FYRMadagascarMalawiMalaysiaMaldivesMaliMaltaMarshall IslandsMauritaniaMauritiusMexicoMicronesia, Fed. Sts.Middle East & North AfricaMiddle East & North Africa (excluding high income)Middle East & North Africa (IDA & IBRD countries)Middle incomeMoldovaMongoliaMontenegroMoroccoMozambiqueMyanmarNamibiaNepalNetherlandsNew CaledoniaNew ZealandNicaraguaNigerNigeriaNorth AmericaNorwayOECD membersOmanOther small statesPacific island small statesPakistanPalauPanamaPapua New GuineaParaguayPeruPhilippinesPolandPortugalPost-demographic dividendPre-demographic dividendQatarRomaniaRussian FederationRwandaSamoaSao Tome and PrincipeSaudi ArabiaSenegalSerbiaSeychellesSierra LeoneSingaporeSint Maarten (Dutch part)Slovak RepublicSloveniaSmall statesSolomon IslandsSouth AfricaSouth AsiaSouth Asia (IDA & IBRD)South SudanSpainSri LankaSt. Kitts and NevisSt. LuciaSt. Vincent and the GrenadinesSub-Saharan Africa Sub-Saharan Africa (excluding high income)Sub-Saharan Africa (IDA & IBRD countries)SudanSurinameSwazilandSwedenSwitzerlandSyrian Arab RepublicTajikistanTanzaniaThailandTimor-LesteTogoTongaTrinidad and TobagoTunisiaTurkeyTuvaluUgandaUkraineUnited KingdomUnited StatesUpper middle incomeUruguayVanuatuVenezuela, RBWest Bank and GazaWorldYemen, Rep.ZambiaZimbabwe Timeline:
This timeline shows a graph from 1975 to 2015 of Oman. No data until 1974. Number of actual observations by date: 41.
Source name:
World Development Indicators
Source organization:
International Monetary Fund, Balance of Payments Statistics Yearbook and data files.
Categories, topics:
Private Sector, Trade
Last updated:
apr 23, 2017
Indicators value changes by year
Minimum:
31.639
jan 1, 2007
At the date of observation
Value
Absolute change
Change from previous value
jan 1, 1975
53.296
+53.296
0.0%
jan 1, 1976
58.542
+5.246
9.84%
jan 1, 1977
56.563
-1.979
-3.38%
jan 1, 1978
56.215
-0.348
-0.62%
jan 1, 1979
59.1
+2.885
5.13%
jan 1, 1980
54.71
-4.39
-7.43%
jan 1, 1981
34.128
-20.583
-37.62%
jan 1, 1982
34.984
+0.856
2.51%
jan 1, 1983
36.84
+1.856
5.31%
jan 1, 1984
34.318
-2.522
-6.85%
jan 1, 1985
39.247
+4.928
14.36%
jan 1, 1986
42.478
+3.231
8.23%
jan 1, 1987
33.536
-8.942
-21.05%
jan 1, 1988
36.973
+3.437
10.25%
jan 1, 1989
40.299
+3.326
8.99%
jan 1, 1990
39.111
-1.188
-2.95%
jan 1, 1991
36.58
-2.531
-6.47%
jan 1, 1992
32.517
-4.063
-11.11%
jan 1, 1993
39.289
+6.772
20.83%
jan 1, 1994
44.548
+5.259
13.39%
jan 1, 1995
41.895
-2.653
-5.95%
jan 1, 1996
41.763
-0.132
-0.31%
jan 1, 1997
33.875
-7.888
-18.89%
jan 1, 1998
31.769
-2.106
-6.22%
jan 1, 1999
37.121
+5.352
16.85%
jan 1, 2000
34.975
-2.146
-5.78%
jan 1, 2001
36.793
+1.817
5.2%
jan 1, 2002
39.455
+2.662
7.24%
jan 1, 2003
41.085
+1.63
4.13%
jan 1, 2004
31.858
-9.227
-22.46%
jan 1, 2005
33.992
+2.134
6.7%
jan 1, 2006
33.404
-0.588
-1.73%
jan 1, 2007
31.639
-1.765
-5.28%
jan 1, 2008
33.793
+2.154
6.81%
jan 1, 2009
43.186
+9.393
27.8%
jan 1, 2010
38.228
-4.958
-11.48%
jan 1, 2011
41.888
+3.66
9.57%
jan 1, 2012
40.269
-1.619
-3.86%
jan 1, 2013
41.595
+1.326
3.29%
jan 1, 2014
44.795
+3.2
7.69%
jan 1, 2015
38.987
-5.809
-12.97%
Ranking of countries by current statistics by years


Comments: