29
/
en
AIzaSyAYiBZKx7MnpbEhh9jyipgxe19OcubqV5w
April 1, 2024
202410
Morocco
MAR
true
2
1
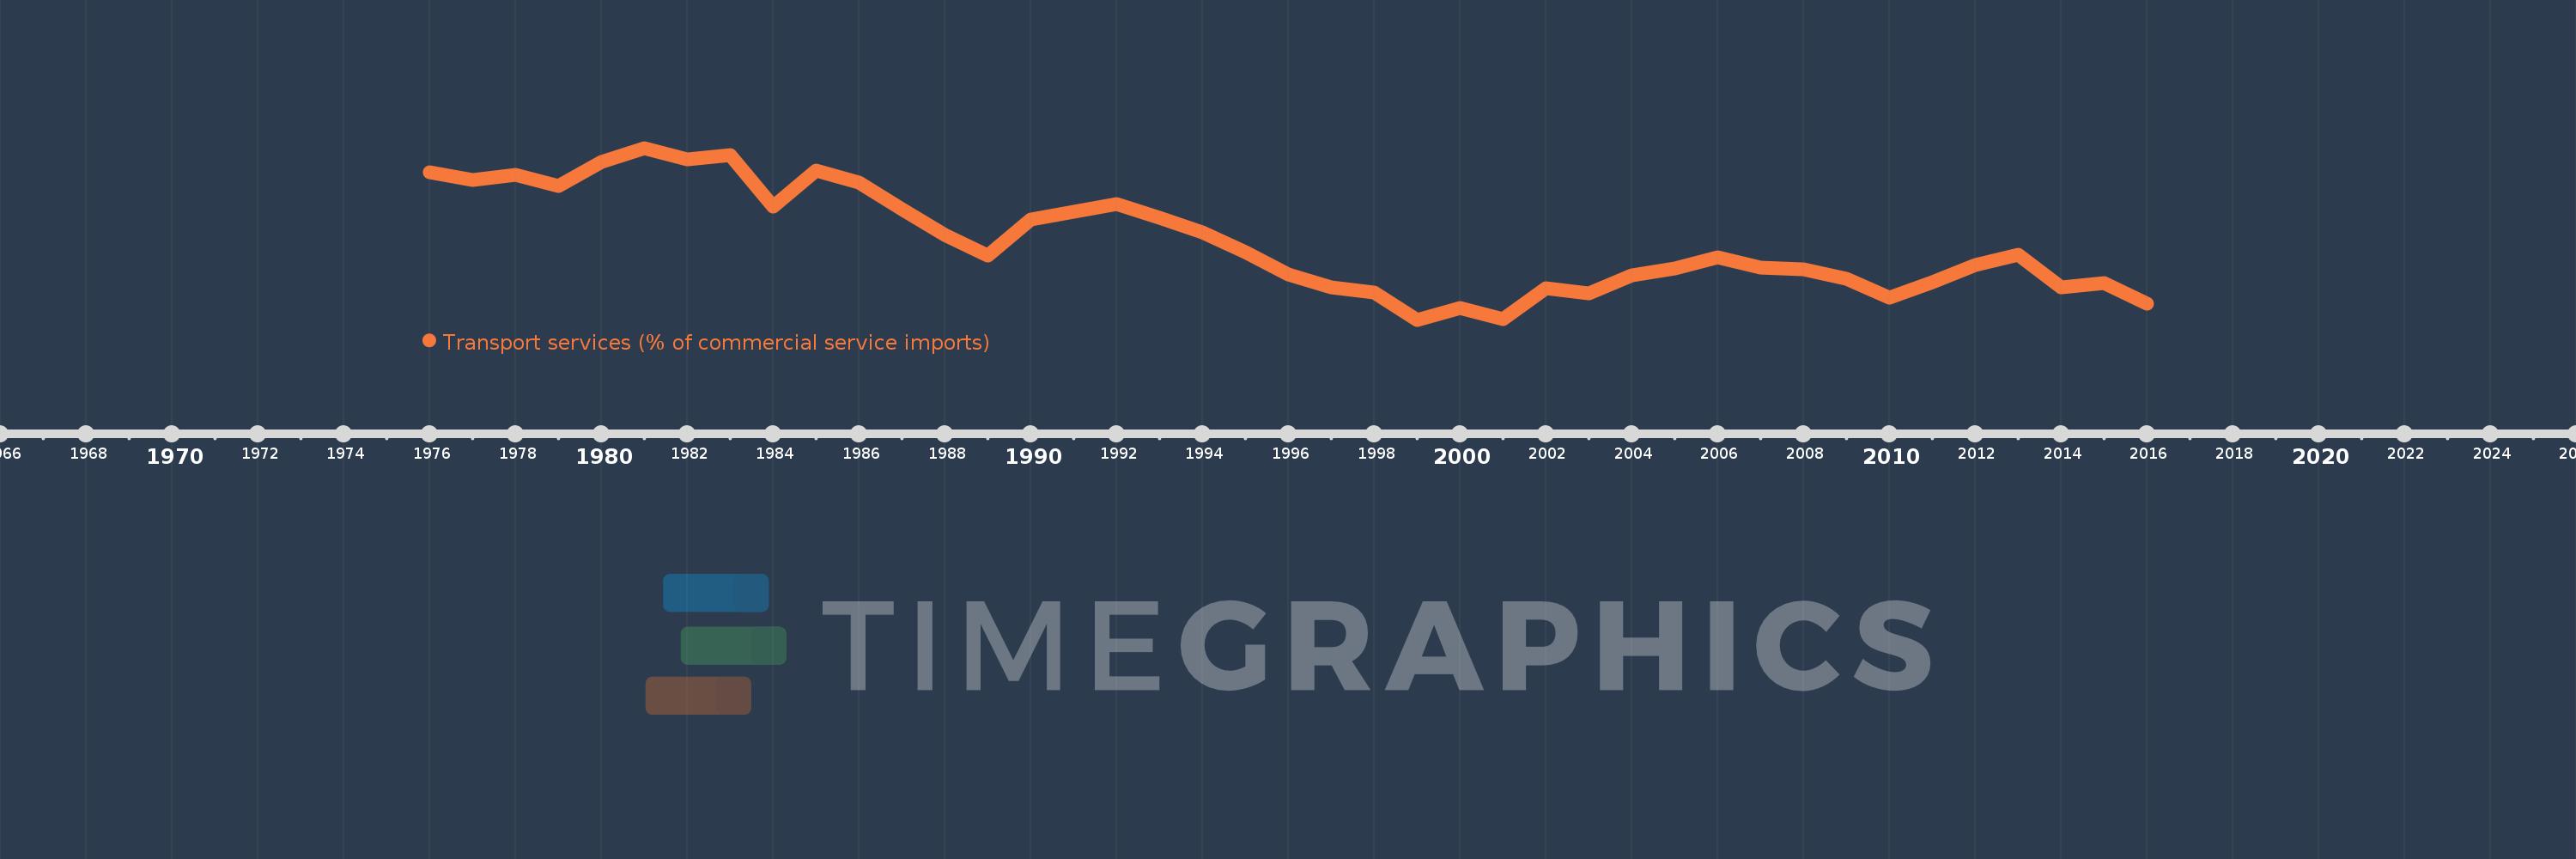
Transport services (% of commercial service imports)
2016,2015,2014,2013,2012,2011,2010,2009,2008,2007,2006,2005,2004,2003,2002,2001,2000,1999,1998,1997,1996,1995,1994,1993,1992,1991,1990,1989,1988,1987,1986,1985,1984,1983,1982,1981,1980,1979,1978,1977,1976
This statistics in other country:
AfghanistanAlbaniaAlgeriaAngolaAntigua and BarbudaArab WorldArgentinaArmeniaArubaAustraliaAustriaAzerbaijanBahamas, TheBahrainBangladeshBarbadosBelarusBelgiumBelizeBeninBermudaBhutanBoliviaBosnia and HerzegovinaBotswanaBrazilBrunei DarussalamBulgariaBurkina FasoBurundiCabo VerdeCambodiaCameroonCanadaCaribbean small statesCentral African RepublicCentral Europe and the BalticsChadChileChinaColombiaComorosCongo, Dem. Rep.Congo, Rep.Costa RicaCote d'IvoireCroatiaCuracaoCyprusCzech RepublicDenmarkDjiboutiDominicaDominican RepublicEarly-demographic dividendEast Asia & PacificEast Asia & Pacific (excluding high income)East Asia & Pacific (IDA & IBRD countries)EcuadorEgypt, Arab Rep.El SalvadorEquatorial GuineaEritreaEstoniaEthiopiaEuro areaEurope & Central AsiaEurope & Central Asia (excluding high income)Europe & Central Asia (IDA & IBRD countries)European UnionFaroe IslandsFijiFinlandFragile and conflict affected situationsFranceFrench PolynesiaGabonGambia, TheGeorgiaGermanyGhanaGreeceGrenadaGuatemalaGuineaGuinea-BissauGuyanaHaitiHeavily indebted poor countries (HIPC)High incomeHondurasHong Kong SAR, ChinaHungaryIBRD onlyIcelandIDA & IBRD totalIDA onlyIDA totalIndiaIndonesiaIran, Islamic Rep.IraqIrelandIsraelItalyJamaicaJapanJordanKazakhstanKenyaKiribatiKorea, Rep.KosovoKuwaitKyrgyz RepublicLao PDRLate-demographic dividendLatin America & Caribbean Latin America & Caribbean (excluding high income)Latin America & the Caribbean (IDA & IBRD countries)LatviaLeast developed countries: UN classificationLebanonLesothoLiberiaLibyaLithuaniaLow & middle incomeLow incomeLower middle incomeLuxembourgMacao SAR, ChinaMacedonia, FYRMadagascarMalawiMalaysiaMaldivesMaliMaltaMarshall IslandsMauritaniaMauritiusMexicoMicronesia, Fed. Sts.Middle East & North AfricaMiddle East & North Africa (excluding high income)Middle East & North Africa (IDA & IBRD countries)Middle incomeMoldovaMongoliaMontenegroMoroccoMozambiqueMyanmarNamibiaNepalNetherlandsNew CaledoniaNew ZealandNicaraguaNigerNigeriaNorth AmericaNorwayOECD membersOmanOther small statesPacific island small statesPakistanPalauPanamaPapua New GuineaParaguayPeruPhilippinesPolandPortugalPost-demographic dividendPre-demographic dividendQatarRomaniaRussian FederationRwandaSamoaSao Tome and PrincipeSaudi ArabiaSenegalSerbiaSeychellesSierra LeoneSingaporeSint Maarten (Dutch part)Slovak RepublicSloveniaSmall statesSolomon IslandsSouth AfricaSouth AsiaSouth Asia (IDA & IBRD)South SudanSpainSri LankaSt. Kitts and NevisSt. LuciaSt. Vincent and the GrenadinesSub-Saharan Africa Sub-Saharan Africa (excluding high income)Sub-Saharan Africa (IDA & IBRD countries)SudanSurinameSwazilandSwedenSwitzerlandSyrian Arab RepublicTajikistanTanzaniaThailandTimor-LesteTogoTongaTrinidad and TobagoTunisiaTurkeyTuvaluUgandaUkraineUnited KingdomUnited StatesUpper middle incomeUruguayVanuatuVenezuela, RBWest Bank and GazaWorldYemen, Rep.ZambiaZimbabwe Timeline:
This timeline shows a graph from 1976 to 2016 of Morocco. No data until 1975. Number of actual observations by date: 41.
Source name:
World Development Indicators
Source organization:
International Monetary Fund, Balance of Payments Statistics Yearbook and data files.
Categories, topics:
Private Sector, Trade
Last updated:
apr 23, 2017
Indicators value changes by year
Minimum:
40.714
jan 1, 1999
Maximum:
68.655
jan 1, 1981
At the date of observation
Value
Absolute change
Change from previous value
jan 1, 1976
64.632
+64.632
0.0%
jan 1, 1977
63.429
-1.204
-1.86%
jan 1, 1978
64.263
+0.834
1.32%
jan 1, 1979
62.53
-1.733
-2.7%
jan 1, 1980
66.384
+3.854
6.16%
jan 1, 1981
68.655
+2.271
3.42%
jan 1, 1982
66.859
-1.796
-2.62%
jan 1, 1983
67.525
+0.666
1.0%
jan 1, 1984
59.129
-8.396
-12.43%
jan 1, 1985
64.925
+5.796
9.8%
jan 1, 1986
63.038
-1.887
-2.91%
jan 1, 1987
58.656
-4.382
-6.95%
jan 1, 1988
54.437
-4.218
-7.19%
jan 1, 1989
51.158
-3.279
-6.02%
jan 1, 1990
56.964
+5.805
11.35%
jan 1, 1991
58.256
+1.292
2.27%
jan 1, 1992
59.586
+1.329
2.28%
jan 1, 1993
57.243
-2.342
-3.93%
jan 1, 1994
54.943
-2.301
-4.02%
jan 1, 1995
51.723
-3.22
-5.86%
jan 1, 1996
48.144
-3.579
-6.92%
jan 1, 1997
45.958
-2.186
-4.54%
jan 1, 1998
45.08
-0.878
-1.91%
jan 1, 1999
40.714
-4.366
-9.68%
jan 1, 2000
42.681
+1.967
4.83%
jan 1, 2001
40.763
-1.918
-4.49%
jan 1, 2002
45.901
+5.138
12.6%
jan 1, 2003
45.048
-0.853
-1.86%
jan 1, 2004
47.981
+2.933
6.51%
jan 1, 2005
49.017
+1.036
2.16%
jan 1, 2006
50.918
+1.9
3.88%
jan 1, 2007
49.241
-1.677
-3.29%
jan 1, 2008
48.846
-0.395
-0.8%
jan 1, 2009
47.324
-1.522
-3.12%
jan 1, 2010
44.29
-3.034
-6.41%
jan 1, 2011
46.866
+2.576
5.82%
jan 1, 2012
49.58
+2.714
5.79%
jan 1, 2013
51.268
+1.688
3.4%
jan 1, 2014
45.978
-5.29
-10.32%
jan 1, 2015
46.697
+0.72
1.57%
jan 1, 2016
43.27
-3.427
-7.34%
Ranking of countries by current statistics by years


Comments: