29
/
en
AIzaSyAYiBZKx7MnpbEhh9jyipgxe19OcubqV5w
April 1, 2024
261726
Tanzania
TZA
true
2
1
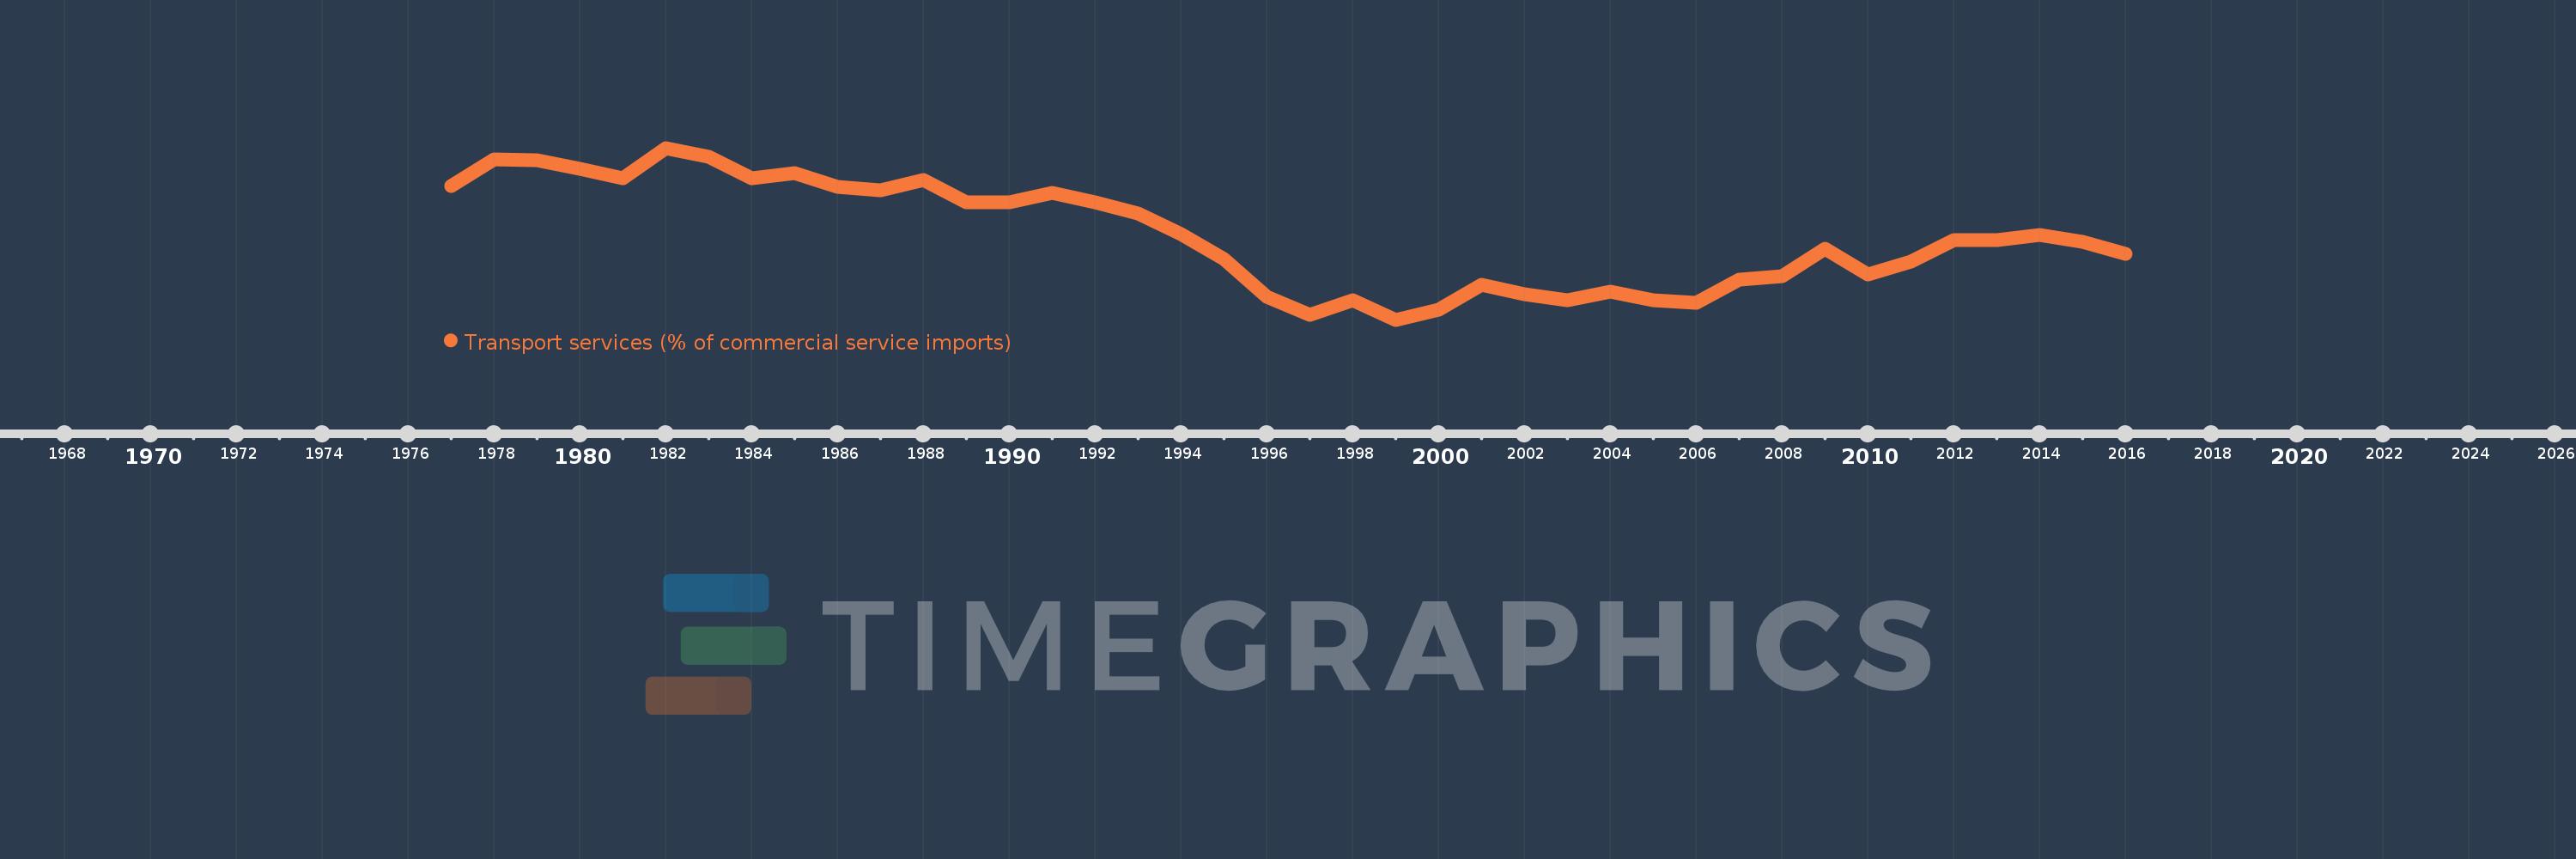
Transport services (% of commercial service imports)
2016,2015,2014,2013,2012,2011,2010,2009,2008,2007,2006,2005,2004,2003,2002,2001,2000,1999,1998,1997,1996,1995,1994,1993,1992,1991,1990,1989,1988,1987,1986,1985,1984,1983,1982,1981,1980,1979,1978,1977
This statistics in other country:
AfghanistanAlbaniaAlgeriaAngolaAntigua and BarbudaArab WorldArgentinaArmeniaArubaAustraliaAustriaAzerbaijanBahamas, TheBahrainBangladeshBarbadosBelarusBelgiumBelizeBeninBermudaBhutanBoliviaBosnia and HerzegovinaBotswanaBrazilBrunei DarussalamBulgariaBurkina FasoBurundiCabo VerdeCambodiaCameroonCanadaCaribbean small statesCentral African RepublicCentral Europe and the BalticsChadChileChinaColombiaComorosCongo, Dem. Rep.Congo, Rep.Costa RicaCote d'IvoireCroatiaCuracaoCyprusCzech RepublicDenmarkDjiboutiDominicaDominican RepublicEarly-demographic dividendEast Asia & PacificEast Asia & Pacific (excluding high income)East Asia & Pacific (IDA & IBRD countries)EcuadorEgypt, Arab Rep.El SalvadorEquatorial GuineaEritreaEstoniaEthiopiaEuro areaEurope & Central AsiaEurope & Central Asia (excluding high income)Europe & Central Asia (IDA & IBRD countries)European UnionFaroe IslandsFijiFinlandFragile and conflict affected situationsFranceFrench PolynesiaGabonGambia, TheGeorgiaGermanyGhanaGreeceGrenadaGuatemalaGuineaGuinea-BissauGuyanaHaitiHeavily indebted poor countries (HIPC)High incomeHondurasHong Kong SAR, ChinaHungaryIBRD onlyIcelandIDA & IBRD totalIDA onlyIDA totalIndiaIndonesiaIran, Islamic Rep.IraqIrelandIsraelItalyJamaicaJapanJordanKazakhstanKenyaKiribatiKorea, Rep.KosovoKuwaitKyrgyz RepublicLao PDRLate-demographic dividendLatin America & Caribbean Latin America & Caribbean (excluding high income)Latin America & the Caribbean (IDA & IBRD countries)LatviaLeast developed countries: UN classificationLebanonLesothoLiberiaLibyaLithuaniaLow & middle incomeLow incomeLower middle incomeLuxembourgMacao SAR, ChinaMacedonia, FYRMadagascarMalawiMalaysiaMaldivesMaliMaltaMarshall IslandsMauritaniaMauritiusMexicoMicronesia, Fed. Sts.Middle East & North AfricaMiddle East & North Africa (excluding high income)Middle East & North Africa (IDA & IBRD countries)Middle incomeMoldovaMongoliaMontenegroMoroccoMozambiqueMyanmarNamibiaNepalNetherlandsNew CaledoniaNew ZealandNicaraguaNigerNigeriaNorth AmericaNorwayOECD membersOmanOther small statesPacific island small statesPakistanPalauPanamaPapua New GuineaParaguayPeruPhilippinesPolandPortugalPost-demographic dividendPre-demographic dividendQatarRomaniaRussian FederationRwandaSamoaSao Tome and PrincipeSaudi ArabiaSenegalSerbiaSeychellesSierra LeoneSingaporeSint Maarten (Dutch part)Slovak RepublicSloveniaSmall statesSolomon IslandsSouth AfricaSouth AsiaSouth Asia (IDA & IBRD)South SudanSpainSri LankaSt. Kitts and NevisSt. LuciaSt. Vincent and the GrenadinesSub-Saharan Africa Sub-Saharan Africa (excluding high income)Sub-Saharan Africa (IDA & IBRD countries)SudanSurinameSwazilandSwedenSwitzerlandSyrian Arab RepublicTajikistanTanzaniaThailandTimor-LesteTogoTongaTrinidad and TobagoTunisiaTurkeyTuvaluUgandaUkraineUnited KingdomUnited StatesUpper middle incomeUruguayVanuatuVenezuela, RBWest Bank and GazaWorldYemen, Rep.ZambiaZimbabwe Timeline:
This timeline shows a graph from 1977 to 2016 of Tanzania. No data until 1976. Number of actual observations by date: 40.
Source name:
World Development Indicators
Source organization:
International Monetary Fund, Balance of Payments Statistics Yearbook and data files.
Categories, topics:
Private Sector, Trade
Last updated:
apr 23, 2017
Indicators value changes by year
Minimum:
23.637
jan 1, 1999
Maximum:
70.287
jan 1, 1982
At the date of observation
Value
Absolute change
Change from previous value
jan 1, 1977
60.036
+60.036
0.0%
jan 1, 1978
67.085
+7.048
11.74%
jan 1, 1979
66.861
-0.224
-0.33%
jan 1, 1980
64.554
-2.307
-3.45%
jan 1, 1981
62.101
-2.453
-3.8%
jan 1, 1982
70.287
+8.186
13.18%
jan 1, 1983
67.796
-2.492
-3.54%
jan 1, 1984
62.111
-5.685
-8.38%
jan 1, 1985
63.423
+1.312
2.11%
jan 1, 1986
59.723
-3.7
-5.83%
jan 1, 1987
58.753
-0.97
-1.62%
jan 1, 1988
61.518
+2.765
4.71%
jan 1, 1989
55.461
-6.057
-9.85%
jan 1, 1990
55.576
+0.115
0.21%
jan 1, 1991
58.012
+2.436
4.38%
jan 1, 1992
55.45
-2.561
-4.42%
jan 1, 1993
52.606
-2.844
-5.13%
jan 1, 1994
46.782
-5.824
-11.07%
jan 1, 1995
40.122
-6.66
-14.24%
jan 1, 1996
29.772
-10.35
-25.8%
jan 1, 1997
24.997
-4.775
-16.04%
jan 1, 1998
29.014
+4.017
16.07%
jan 1, 1999
23.637
-5.377
-18.53%
jan 1, 2000
26.251
+2.614
11.06%
jan 1, 2001
33.177
+6.926
26.38%
jan 1, 2002
30.604
-2.573
-7.76%
jan 1, 2003
28.976
-1.628
-5.32%
jan 1, 2004
31.334
+2.358
8.14%
jan 1, 2005
28.948
-2.387
-7.62%
jan 1, 2006
28.247
-0.7
-2.42%
jan 1, 2007
34.506
+6.259
22.16%
jan 1, 2008
35.562
+1.056
3.06%
jan 1, 2009
42.966
+7.405
20.82%
jan 1, 2010
35.9
-7.067
-16.45%
jan 1, 2011
39.45
+3.55
9.89%
jan 1, 2012
45.332
+5.882
14.91%
jan 1, 2013
45.325
-0.007
-0.02%
jan 1, 2014
46.718
+1.393
3.07%
jan 1, 2015
44.74
-1.978
-4.23%
jan 1, 2016
41.556
-3.185
-7.12%
Ranking of countries by current statistics by years


Comments: