29
/
en
AIzaSyAYiBZKx7MnpbEhh9jyipgxe19OcubqV5w
April 1, 2024
217268
Pakistan
PAK
true
2
1
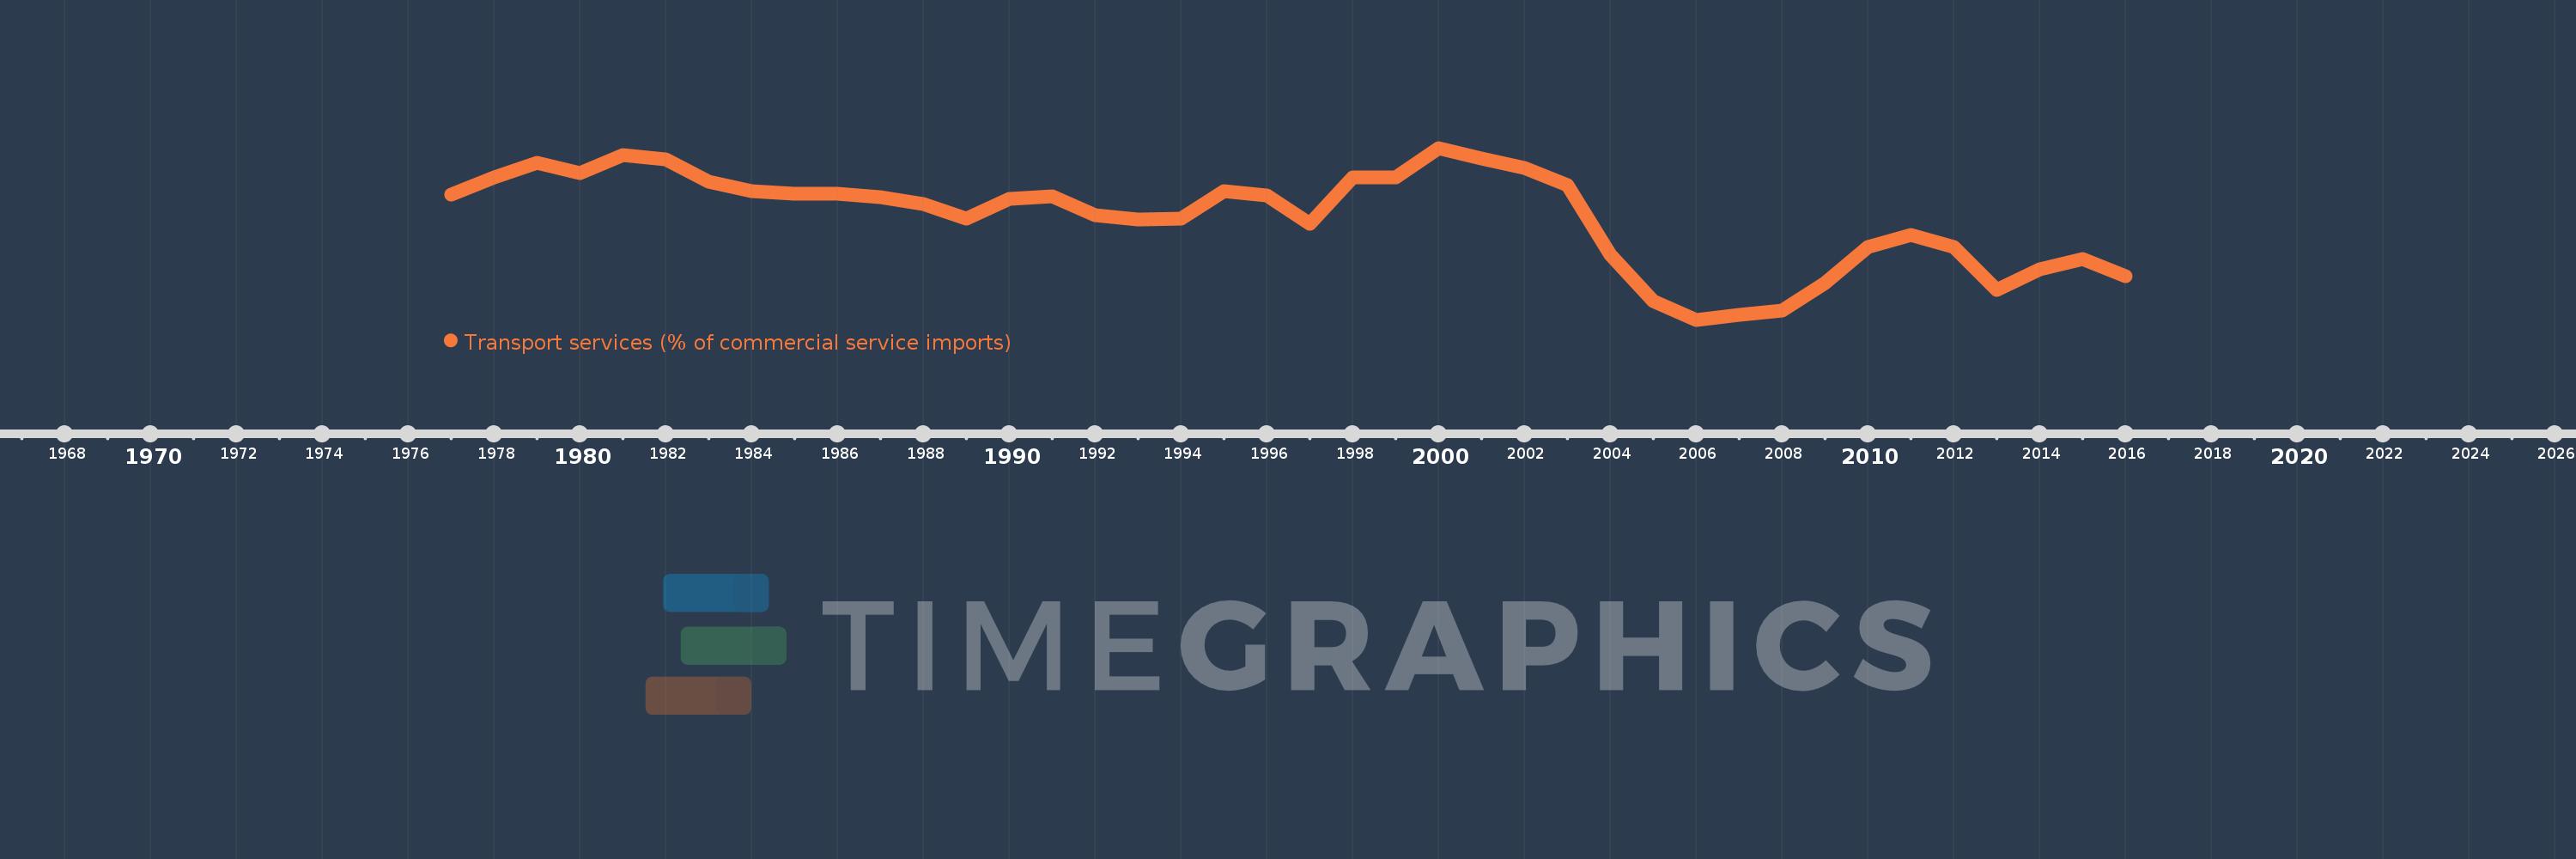
Transport services (% of commercial service imports)
2016,2015,2014,2013,2012,2011,2010,2009,2008,2007,2006,2005,2004,2003,2002,2001,2000,1999,1998,1997,1996,1995,1994,1993,1992,1991,1990,1989,1988,1987,1986,1985,1984,1983,1982,1981,1980,1979,1978,1977
This statistics in other country:
AfghanistanAlbaniaAlgeriaAngolaAntigua and BarbudaArab WorldArgentinaArmeniaArubaAustraliaAustriaAzerbaijanBahamas, TheBahrainBangladeshBarbadosBelarusBelgiumBelizeBeninBermudaBhutanBoliviaBosnia and HerzegovinaBotswanaBrazilBrunei DarussalamBulgariaBurkina FasoBurundiCabo VerdeCambodiaCameroonCanadaCaribbean small statesCentral African RepublicCentral Europe and the BalticsChadChileChinaColombiaComorosCongo, Dem. Rep.Congo, Rep.Costa RicaCote d'IvoireCroatiaCuracaoCyprusCzech RepublicDenmarkDjiboutiDominicaDominican RepublicEarly-demographic dividendEast Asia & PacificEast Asia & Pacific (excluding high income)East Asia & Pacific (IDA & IBRD countries)EcuadorEgypt, Arab Rep.El SalvadorEquatorial GuineaEritreaEstoniaEthiopiaEuro areaEurope & Central AsiaEurope & Central Asia (excluding high income)Europe & Central Asia (IDA & IBRD countries)European UnionFaroe IslandsFijiFinlandFragile and conflict affected situationsFranceFrench PolynesiaGabonGambia, TheGeorgiaGermanyGhanaGreeceGrenadaGuatemalaGuineaGuinea-BissauGuyanaHaitiHeavily indebted poor countries (HIPC)High incomeHondurasHong Kong SAR, ChinaHungaryIBRD onlyIcelandIDA & IBRD totalIDA onlyIDA totalIndiaIndonesiaIran, Islamic Rep.IraqIrelandIsraelItalyJamaicaJapanJordanKazakhstanKenyaKiribatiKorea, Rep.KosovoKuwaitKyrgyz RepublicLao PDRLate-demographic dividendLatin America & Caribbean Latin America & Caribbean (excluding high income)Latin America & the Caribbean (IDA & IBRD countries)LatviaLeast developed countries: UN classificationLebanonLesothoLiberiaLibyaLithuaniaLow & middle incomeLow incomeLower middle incomeLuxembourgMacao SAR, ChinaMacedonia, FYRMadagascarMalawiMalaysiaMaldivesMaliMaltaMarshall IslandsMauritaniaMauritiusMexicoMicronesia, Fed. Sts.Middle East & North AfricaMiddle East & North Africa (excluding high income)Middle East & North Africa (IDA & IBRD countries)Middle incomeMoldovaMongoliaMontenegroMoroccoMozambiqueMyanmarNamibiaNepalNetherlandsNew CaledoniaNew ZealandNicaraguaNigerNigeriaNorth AmericaNorwayOECD membersOmanOther small statesPacific island small statesPakistanPalauPanamaPapua New GuineaParaguayPeruPhilippinesPolandPortugalPost-demographic dividendPre-demographic dividendQatarRomaniaRussian FederationRwandaSamoaSao Tome and PrincipeSaudi ArabiaSenegalSerbiaSeychellesSierra LeoneSingaporeSint Maarten (Dutch part)Slovak RepublicSloveniaSmall statesSolomon IslandsSouth AfricaSouth AsiaSouth Asia (IDA & IBRD)South SudanSpainSri LankaSt. Kitts and NevisSt. LuciaSt. Vincent and the GrenadinesSub-Saharan Africa Sub-Saharan Africa (excluding high income)Sub-Saharan Africa (IDA & IBRD countries)SudanSurinameSwazilandSwedenSwitzerlandSyrian Arab RepublicTajikistanTanzaniaThailandTimor-LesteTogoTongaTrinidad and TobagoTunisiaTurkeyTuvaluUgandaUkraineUnited KingdomUnited StatesUpper middle incomeUruguayVanuatuVenezuela, RBWest Bank and GazaWorldYemen, Rep.ZambiaZimbabwe Timeline:
This timeline shows a graph from 1977 to 2016 of Pakistan. No data until 1976. Number of actual observations by date: 40.
Source name:
World Development Indicators
Source organization:
International Monetary Fund, Balance of Payments Statistics Yearbook and data files.
Categories, topics:
Private Sector, Trade
Last updated:
apr 23, 2017
Indicators value changes by year
Minimum:
36.008
jan 1, 2006
Maximum:
78.974
jan 1, 2000
At the date of observation
Value
Absolute change
Change from previous value
jan 1, 1977
67.294
+67.294
0.0%
jan 1, 1978
71.612
+4.318
6.42%
jan 1, 1979
75.259
+3.647
5.09%
jan 1, 1980
72.765
-2.494
-3.31%
jan 1, 1981
77.116
+4.35
5.98%
jan 1, 1982
76.101
-1.015
-1.32%
jan 1, 1983
70.452
-5.649
-7.42%
jan 1, 1984
68.214
-2.238
-3.18%
jan 1, 1985
67.425
-0.789
-1.16%
jan 1, 1986
67.446
+0.021
0.03%
jan 1, 1987
66.581
-0.865
-1.28%
jan 1, 1988
65.004
-1.577
-2.37%
jan 1, 1989
61.198
-3.805
-5.85%
jan 1, 1990
66.313
+5.115
8.36%
jan 1, 1991
66.974
+0.661
1.0%
jan 1, 1992
62.066
-4.908
-7.33%
jan 1, 1993
61.165
-0.901
-1.45%
jan 1, 1994
61.283
+0.118
0.19%
jan 1, 1995
68.229
+6.947
11.34%
jan 1, 1996
66.992
-1.237
-1.81%
jan 1, 1997
60.111
-6.881
-10.27%
jan 1, 1998
71.588
+11.477
19.09%
jan 1, 1999
71.671
+0.083
0.12%
jan 1, 2000
78.974
+7.303
10.19%
jan 1, 2001
76.346
-2.628
-3.33%
jan 1, 2002
74.058
-2.288
-3.0%
jan 1, 2003
69.679
-4.379
-5.91%
jan 1, 2004
52.303
-17.376
-24.94%
jan 1, 2005
40.686
-11.617
-22.21%
jan 1, 2006
36.008
-4.678
-11.5%
jan 1, 2007
37.214
+1.206
3.35%
jan 1, 2008
38.402
+1.188
3.19%
jan 1, 2009
45.089
+6.686
17.41%
jan 1, 2010
54.136
+9.048
20.07%
jan 1, 2011
57.167
+3.031
5.6%
jan 1, 2012
54.171
-2.996
-5.24%
jan 1, 2013
43.49
-10.681
-19.72%
jan 1, 2014
48.529
+5.04
11.59%
jan 1, 2015
51.134
+2.605
5.37%
jan 1, 2016
46.971
-4.163
-8.14%
Ranking of countries by current statistics by years


Comments: