29
/
en
AIzaSyAYiBZKx7MnpbEhh9jyipgxe19OcubqV5w
April 1, 2024
224417
Philippines
PHL
true
2
1
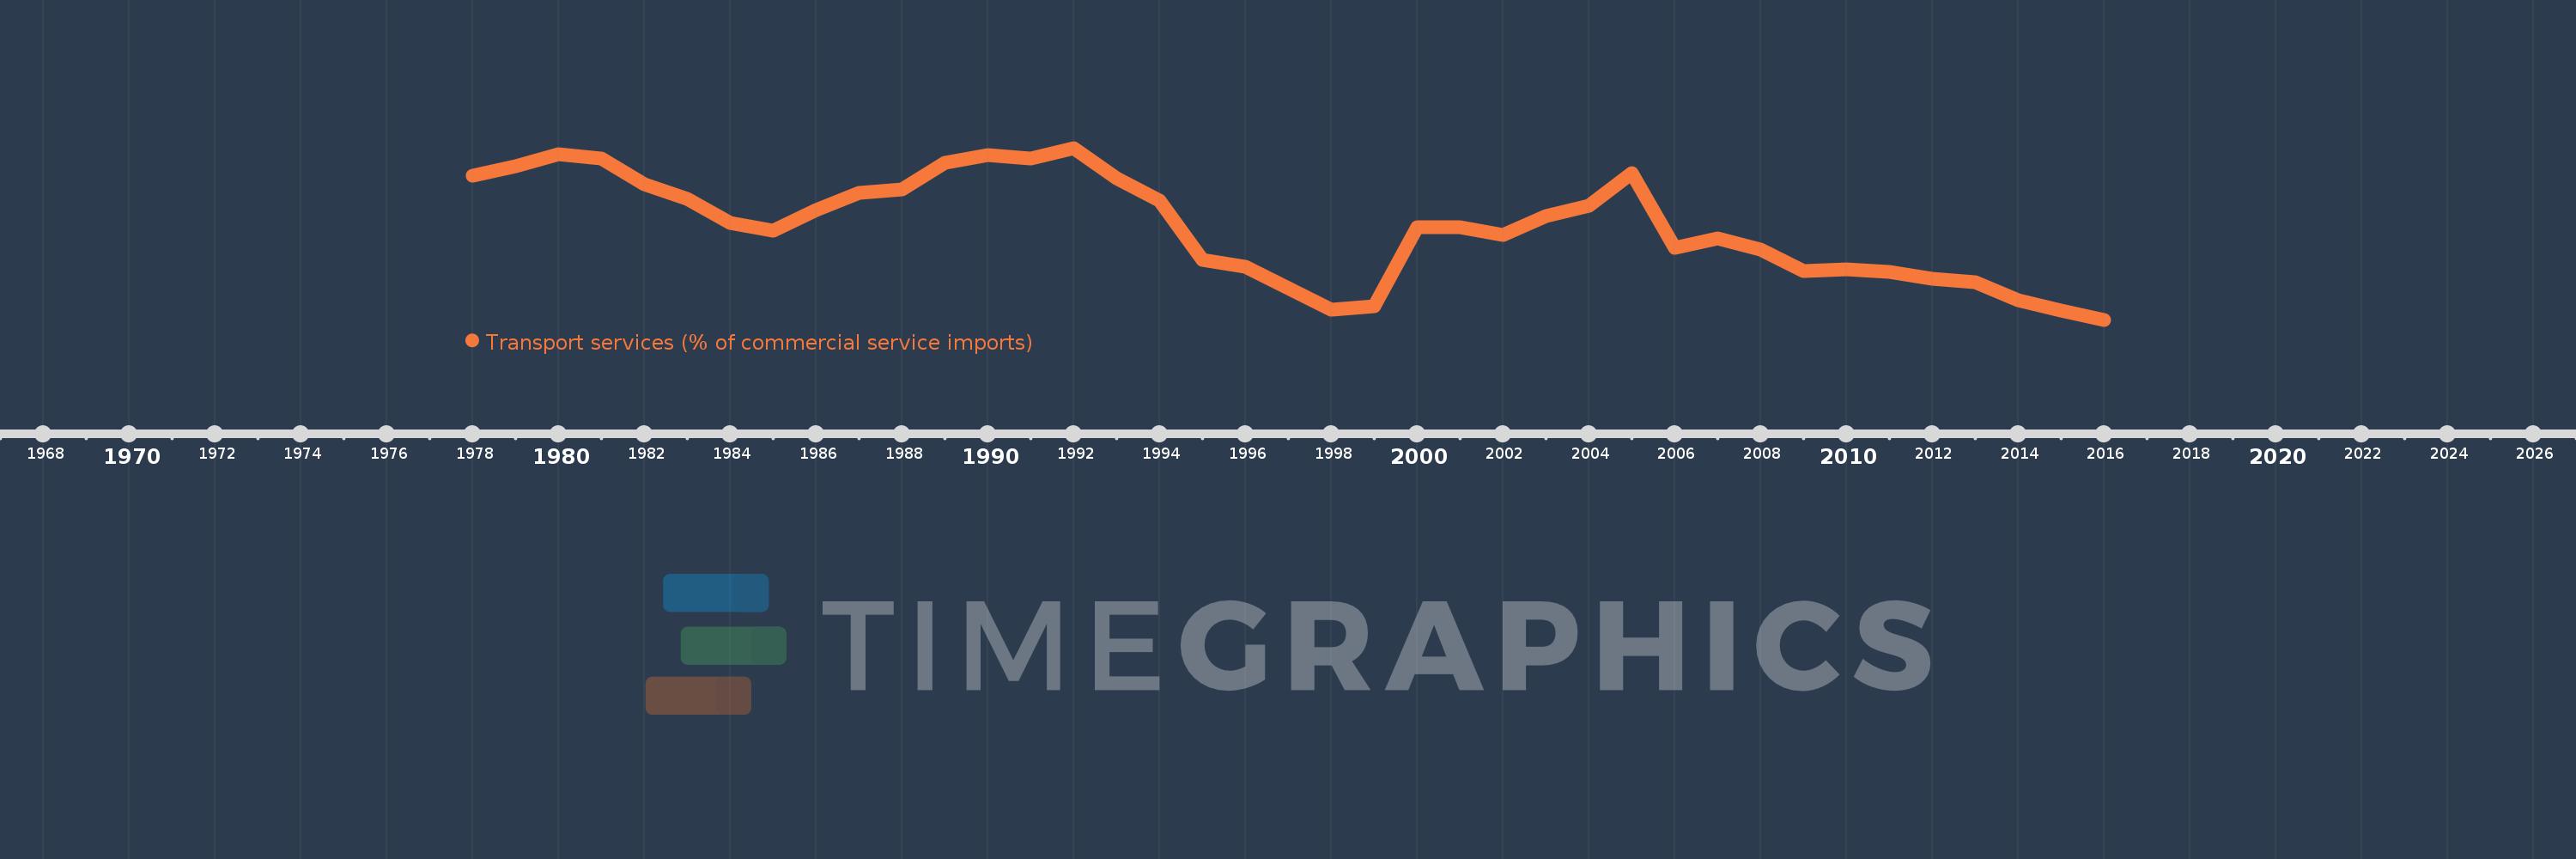
Transport services (% of commercial service imports)
2016,2015,2014,2013,2012,2011,2010,2009,2008,2007,2006,2005,2004,2003,2002,2001,2000,1999,1998,1997,1996,1995,1994,1993,1992,1991,1990,1989,1988,1987,1986,1985,1984,1983,1982,1981,1980,1979,1978
This statistics in other country:
AfghanistanAlbaniaAlgeriaAngolaAntigua and BarbudaArab WorldArgentinaArmeniaArubaAustraliaAustriaAzerbaijanBahamas, TheBahrainBangladeshBarbadosBelarusBelgiumBelizeBeninBermudaBhutanBoliviaBosnia and HerzegovinaBotswanaBrazilBrunei DarussalamBulgariaBurkina FasoBurundiCabo VerdeCambodiaCameroonCanadaCaribbean small statesCentral African RepublicCentral Europe and the BalticsChadChileChinaColombiaComorosCongo, Dem. Rep.Congo, Rep.Costa RicaCote d'IvoireCroatiaCuracaoCyprusCzech RepublicDenmarkDjiboutiDominicaDominican RepublicEarly-demographic dividendEast Asia & PacificEast Asia & Pacific (excluding high income)East Asia & Pacific (IDA & IBRD countries)EcuadorEgypt, Arab Rep.El SalvadorEquatorial GuineaEritreaEstoniaEthiopiaEuro areaEurope & Central AsiaEurope & Central Asia (excluding high income)Europe & Central Asia (IDA & IBRD countries)European UnionFaroe IslandsFijiFinlandFragile and conflict affected situationsFranceFrench PolynesiaGabonGambia, TheGeorgiaGermanyGhanaGreeceGrenadaGuatemalaGuineaGuinea-BissauGuyanaHaitiHeavily indebted poor countries (HIPC)High incomeHondurasHong Kong SAR, ChinaHungaryIBRD onlyIcelandIDA & IBRD totalIDA onlyIDA totalIndiaIndonesiaIran, Islamic Rep.IraqIrelandIsraelItalyJamaicaJapanJordanKazakhstanKenyaKiribatiKorea, Rep.KosovoKuwaitKyrgyz RepublicLao PDRLate-demographic dividendLatin America & Caribbean Latin America & Caribbean (excluding high income)Latin America & the Caribbean (IDA & IBRD countries)LatviaLeast developed countries: UN classificationLebanonLesothoLiberiaLibyaLithuaniaLow & middle incomeLow incomeLower middle incomeLuxembourgMacao SAR, ChinaMacedonia, FYRMadagascarMalawiMalaysiaMaldivesMaliMaltaMarshall IslandsMauritaniaMauritiusMexicoMicronesia, Fed. Sts.Middle East & North AfricaMiddle East & North Africa (excluding high income)Middle East & North Africa (IDA & IBRD countries)Middle incomeMoldovaMongoliaMontenegroMoroccoMozambiqueMyanmarNamibiaNepalNetherlandsNew CaledoniaNew ZealandNicaraguaNigerNigeriaNorth AmericaNorwayOECD membersOmanOther small statesPacific island small statesPakistanPalauPanamaPapua New GuineaParaguayPeruPhilippinesPolandPortugalPost-demographic dividendPre-demographic dividendQatarRomaniaRussian FederationRwandaSamoaSao Tome and PrincipeSaudi ArabiaSenegalSerbiaSeychellesSierra LeoneSingaporeSint Maarten (Dutch part)Slovak RepublicSloveniaSmall statesSolomon IslandsSouth AfricaSouth AsiaSouth Asia (IDA & IBRD)South SudanSpainSri LankaSt. Kitts and NevisSt. LuciaSt. Vincent and the GrenadinesSub-Saharan Africa Sub-Saharan Africa (excluding high income)Sub-Saharan Africa (IDA & IBRD countries)SudanSurinameSwazilandSwedenSwitzerlandSyrian Arab RepublicTajikistanTanzaniaThailandTimor-LesteTogoTongaTrinidad and TobagoTunisiaTurkeyTuvaluUgandaUkraineUnited KingdomUnited StatesUpper middle incomeUruguayVanuatuVenezuela, RBWest Bank and GazaWorldYemen, Rep.ZambiaZimbabwe Timeline:
This timeline shows a graph from 1978 to 2016 of Philippines. No data until 1977. Number of actual observations by date: 39.
Source name:
World Development Indicators
Source organization:
International Monetary Fund, Balance of Payments Statistics Yearbook and data files.
Categories, topics:
Private Sector, Trade
Last updated:
apr 23, 2017
Indicators value changes by year
Minimum:
16.363
jan 1, 2016
Maximum:
59.563
jan 1, 1992
At the date of observation
Value
Absolute change
Change from previous value
jan 1, 1978
52.645
+52.645
0.0%
jan 1, 1979
54.911
+2.266
4.3%
jan 1, 1980
57.904
+2.994
5.45%
jan 1, 1981
56.829
-1.076
-1.86%
jan 1, 1982
50.329
-6.5
-11.44%
jan 1, 1983
46.853
-3.475
-6.91%
jan 1, 1984
40.738
-6.115
-13.05%
jan 1, 1985
38.729
-2.009
-4.93%
jan 1, 1986
44.024
+5.294
13.67%
jan 1, 1987
48.238
+4.214
9.57%
jan 1, 1988
49.11
+0.872
1.81%
jan 1, 1989
55.803
+6.693
13.63%
jan 1, 1990
57.747
+1.944
3.48%
jan 1, 1991
56.944
-0.804
-1.39%
jan 1, 1992
59.563
+2.619
4.6%
jan 1, 1993
52.017
-7.545
-12.67%
jan 1, 1994
46.387
-5.631
-10.82%
jan 1, 1995
31.408
-14.979
-32.29%
jan 1, 1996
29.699
-1.709
-5.44%
jan 1, 1997
24.351
-5.348
-18.01%
jan 1, 1998
18.994
-5.357
-22.0%
jan 1, 1999
19.659
+0.665
3.5%
jan 1, 2000
39.649
+19.99
101.68%
jan 1, 2001
39.652
+0.003
0.01%
jan 1, 2002
37.752
-1.9
-4.79%
jan 1, 2003
42.342
+4.59
12.16%
jan 1, 2004
44.988
+2.646
6.25%
jan 1, 2005
53.234
+8.246
18.33%
jan 1, 2006
34.373
-18.86
-35.43%
jan 1, 2007
36.821
+2.448
7.12%
jan 1, 2008
34.081
-2.74
-7.44%
jan 1, 2009
28.57
-5.512
-16.17%
jan 1, 2010
29.108
+0.538
1.88%
jan 1, 2011
28.349
-0.759
-2.61%
jan 1, 2012
26.692
-1.657
-5.84%
jan 1, 2013
25.86
-0.832
-3.12%
jan 1, 2014
21.289
-4.572
-17.68%
jan 1, 2015
18.777
-2.511
-11.8%
jan 1, 2016
16.363
-2.415
-12.86%
Ranking of countries by current statistics by years


Comments: