29
/
en
AIzaSyAYiBZKx7MnpbEhh9jyipgxe19OcubqV5w
April 1, 2024
55232
Post-demographic dividend
PST
false
2
1
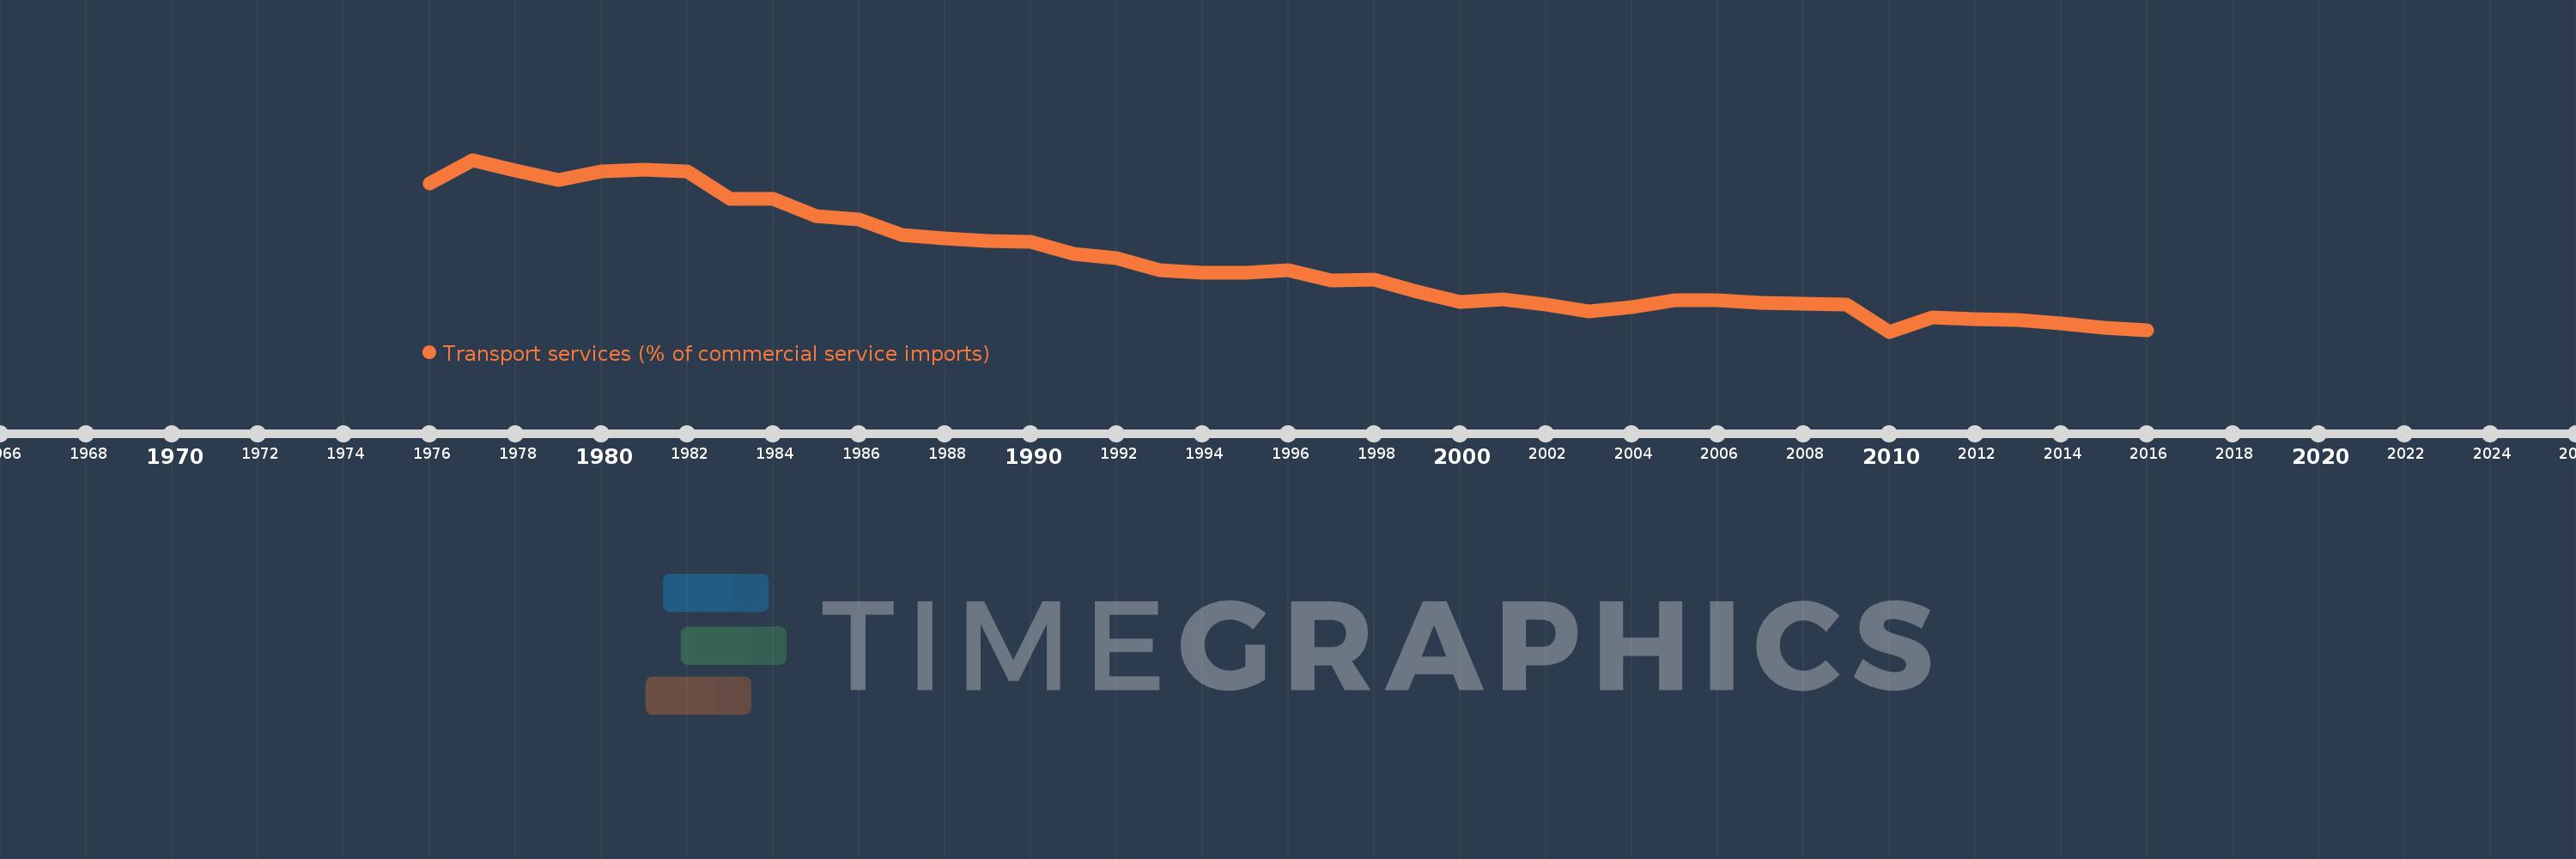
Transport services (% of commercial service imports)
2016,2015,2014,2013,2012,2011,2010,2009,2008,2007,2006,2005,2004,2003,2002,2001,2000,1999,1998,1997,1996,1995,1994,1993,1992,1991,1990,1989,1988,1987,1986,1985,1984,1983,1982,1981,1980,1979,1978,1977,1976
This statistics in other country:
AfghanistanAlbaniaAlgeriaAngolaAntigua and BarbudaArab WorldArgentinaArmeniaArubaAustraliaAustriaAzerbaijanBahamas, TheBahrainBangladeshBarbadosBelarusBelgiumBelizeBeninBermudaBhutanBoliviaBosnia and HerzegovinaBotswanaBrazilBrunei DarussalamBulgariaBurkina FasoBurundiCabo VerdeCambodiaCameroonCanadaCaribbean small statesCentral African RepublicCentral Europe and the BalticsChadChileChinaColombiaComorosCongo, Dem. Rep.Congo, Rep.Costa RicaCote d'IvoireCroatiaCuracaoCyprusCzech RepublicDenmarkDjiboutiDominicaDominican RepublicEarly-demographic dividendEast Asia & PacificEast Asia & Pacific (excluding high income)East Asia & Pacific (IDA & IBRD countries)EcuadorEgypt, Arab Rep.El SalvadorEquatorial GuineaEritreaEstoniaEthiopiaEuro areaEurope & Central AsiaEurope & Central Asia (excluding high income)Europe & Central Asia (IDA & IBRD countries)European UnionFaroe IslandsFijiFinlandFragile and conflict affected situationsFranceFrench PolynesiaGabonGambia, TheGeorgiaGermanyGhanaGreeceGrenadaGuatemalaGuineaGuinea-BissauGuyanaHaitiHeavily indebted poor countries (HIPC)High incomeHondurasHong Kong SAR, ChinaHungaryIBRD onlyIcelandIDA & IBRD totalIDA onlyIDA totalIndiaIndonesiaIran, Islamic Rep.IraqIrelandIsraelItalyJamaicaJapanJordanKazakhstanKenyaKiribatiKorea, Rep.KosovoKuwaitKyrgyz RepublicLao PDRLate-demographic dividendLatin America & Caribbean Latin America & Caribbean (excluding high income)Latin America & the Caribbean (IDA & IBRD countries)LatviaLeast developed countries: UN classificationLebanonLesothoLiberiaLibyaLithuaniaLow & middle incomeLow incomeLower middle incomeLuxembourgMacao SAR, ChinaMacedonia, FYRMadagascarMalawiMalaysiaMaldivesMaliMaltaMarshall IslandsMauritaniaMauritiusMexicoMicronesia, Fed. Sts.Middle East & North AfricaMiddle East & North Africa (excluding high income)Middle East & North Africa (IDA & IBRD countries)Middle incomeMoldovaMongoliaMontenegroMoroccoMozambiqueMyanmarNamibiaNepalNetherlandsNew CaledoniaNew ZealandNicaraguaNigerNigeriaNorth AmericaNorwayOECD membersOmanOther small statesPacific island small statesPakistanPalauPanamaPapua New GuineaParaguayPeruPhilippinesPolandPortugalPost-demographic dividendPre-demographic dividendQatarRomaniaRussian FederationRwandaSamoaSao Tome and PrincipeSaudi ArabiaSenegalSerbiaSeychellesSierra LeoneSingaporeSint Maarten (Dutch part)Slovak RepublicSloveniaSmall statesSolomon IslandsSouth AfricaSouth AsiaSouth Asia (IDA & IBRD)South SudanSpainSri LankaSt. Kitts and NevisSt. LuciaSt. Vincent and the GrenadinesSub-Saharan Africa Sub-Saharan Africa (excluding high income)Sub-Saharan Africa (IDA & IBRD countries)SudanSurinameSwazilandSwedenSwitzerlandSyrian Arab RepublicTajikistanTanzaniaThailandTimor-LesteTogoTongaTrinidad and TobagoTunisiaTurkeyTuvaluUgandaUkraineUnited KingdomUnited StatesUpper middle incomeUruguayVanuatuVenezuela, RBWest Bank and GazaWorldYemen, Rep.ZambiaZimbabwe Timeline:
This timeline shows a graph from 1976 to 2016 of Post-demographic dividend. No data until 1975. Number of actual observations by date: 41.
Source name:
World Development Indicators
Source organization:
International Monetary Fund, Balance of Payments Statistics Yearbook and data files.
Categories, topics:
Private Sector, Trade
Last updated:
apr 23, 2017
Indicators value changes by year
Minimum:
21.668
jan 1, 2010
Maximum:
44.041
jan 1, 1977
At the date of observation
Value
Absolute change
Change from previous value
jan 1, 1976
40.921
+40.921
0.0%
jan 1, 1977
44.041
+3.12
7.62%
jan 1, 1978
42.616
-1.425
-3.24%
jan 1, 1979
41.384
-1.232
-2.89%
jan 1, 1980
42.584
+1.2
2.9%
jan 1, 1981
42.712
+0.128
0.3%
jan 1, 1982
42.558
-0.154
-0.36%
jan 1, 1983
38.981
-3.577
-8.4%
jan 1, 1984
38.95
-0.031
-0.08%
jan 1, 1985
36.709
-2.242
-5.75%
jan 1, 1986
36.223
-0.486
-1.32%
jan 1, 1987
34.247
-1.976
-5.45%
jan 1, 1988
33.856
-0.391
-1.14%
jan 1, 1989
33.492
-0.364
-1.07%
jan 1, 1990
33.392
-0.101
-0.3%
jan 1, 1991
31.794
-1.597
-4.78%
jan 1, 1992
31.183
-0.612
-1.92%
jan 1, 1993
29.688
-1.495
-4.79%
jan 1, 1994
29.363
-0.325
-1.1%
jan 1, 1995
29.362
-0.001
0.0%
jan 1, 1996
29.626
+0.263
0.9%
jan 1, 1997
28.372
-1.254
-4.23%
jan 1, 1998
28.421
+0.049
0.17%
jan 1, 1999
26.879
-1.541
-5.42%
jan 1, 2000
25.539
-1.34
-4.99%
jan 1, 2001
25.889
+0.35
1.37%
jan 1, 2002
25.198
-0.69
-2.67%
jan 1, 2003
24.261
-0.938
-3.72%
jan 1, 2004
24.882
+0.622
2.56%
jan 1, 2005
25.776
+0.893
3.59%
jan 1, 2006
25.791
+0.015
0.06%
jan 1, 2007
25.369
-0.422
-1.64%
jan 1, 2008
25.295
-0.074
-0.29%
jan 1, 2009
25.181
-0.114
-0.45%
jan 1, 2010
21.668
-3.512
-13.95%
jan 1, 2011
23.497
+1.828
8.44%
jan 1, 2012
23.277
-0.219
-0.93%
jan 1, 2013
23.166
-0.112
-0.48%
jan 1, 2014
22.687
-0.479
-2.07%
jan 1, 2015
22.168
-0.519
-2.29%
jan 1, 2016
21.861
-0.307
-1.39%
Ranking of countries by current statistics by years


Comments: