29
/
en
AIzaSyAYiBZKx7MnpbEhh9jyipgxe19OcubqV5w
April 1, 2024
153184
Hungary
HUN
true
2
1
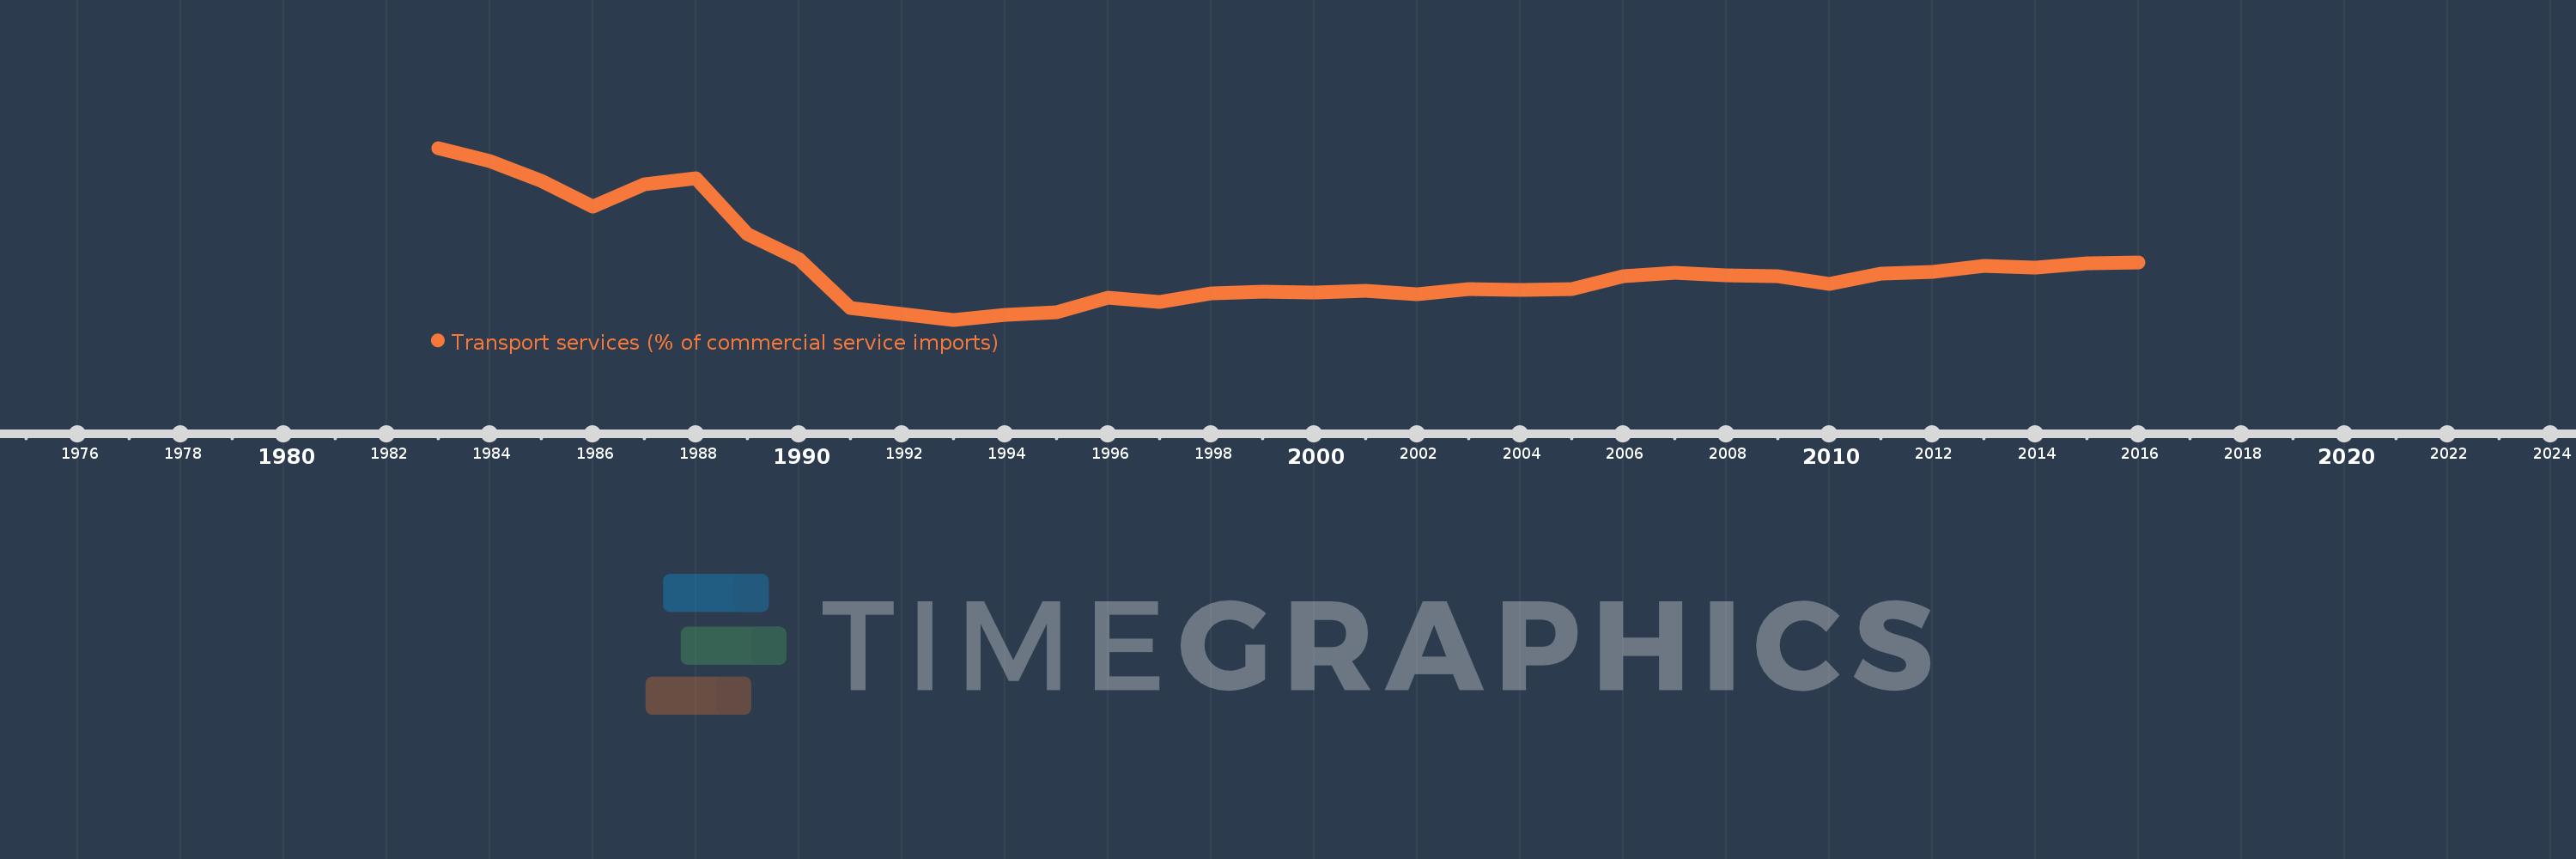
Transport services (% of commercial service imports)
2016,2015,2014,2013,2012,2011,2010,2009,2008,2007,2006,2005,2004,2003,2002,2001,2000,1999,1998,1997,1996,1995,1994,1993,1992,1991,1990,1989,1988,1987,1986,1985,1984,1983
This statistics in other country:
AfghanistanAlbaniaAlgeriaAngolaAntigua and BarbudaArab WorldArgentinaArmeniaArubaAustraliaAustriaAzerbaijanBahamas, TheBahrainBangladeshBarbadosBelarusBelgiumBelizeBeninBermudaBhutanBoliviaBosnia and HerzegovinaBotswanaBrazilBrunei DarussalamBulgariaBurkina FasoBurundiCabo VerdeCambodiaCameroonCanadaCaribbean small statesCentral African RepublicCentral Europe and the BalticsChadChileChinaColombiaComorosCongo, Dem. Rep.Congo, Rep.Costa RicaCote d'IvoireCroatiaCuracaoCyprusCzech RepublicDenmarkDjiboutiDominicaDominican RepublicEarly-demographic dividendEast Asia & PacificEast Asia & Pacific (excluding high income)East Asia & Pacific (IDA & IBRD countries)EcuadorEgypt, Arab Rep.El SalvadorEquatorial GuineaEritreaEstoniaEthiopiaEuro areaEurope & Central AsiaEurope & Central Asia (excluding high income)Europe & Central Asia (IDA & IBRD countries)European UnionFaroe IslandsFijiFinlandFragile and conflict affected situationsFranceFrench PolynesiaGabonGambia, TheGeorgiaGermanyGhanaGreeceGrenadaGuatemalaGuineaGuinea-BissauGuyanaHaitiHeavily indebted poor countries (HIPC)High incomeHondurasHong Kong SAR, ChinaHungaryIBRD onlyIcelandIDA & IBRD totalIDA onlyIDA totalIndiaIndonesiaIran, Islamic Rep.IraqIrelandIsraelItalyJamaicaJapanJordanKazakhstanKenyaKiribatiKorea, Rep.KosovoKuwaitKyrgyz RepublicLao PDRLate-demographic dividendLatin America & Caribbean Latin America & Caribbean (excluding high income)Latin America & the Caribbean (IDA & IBRD countries)LatviaLeast developed countries: UN classificationLebanonLesothoLiberiaLibyaLithuaniaLow & middle incomeLow incomeLower middle incomeLuxembourgMacao SAR, ChinaMacedonia, FYRMadagascarMalawiMalaysiaMaldivesMaliMaltaMarshall IslandsMauritaniaMauritiusMexicoMicronesia, Fed. Sts.Middle East & North AfricaMiddle East & North Africa (excluding high income)Middle East & North Africa (IDA & IBRD countries)Middle incomeMoldovaMongoliaMontenegroMoroccoMozambiqueMyanmarNamibiaNepalNetherlandsNew CaledoniaNew ZealandNicaraguaNigerNigeriaNorth AmericaNorwayOECD membersOmanOther small statesPacific island small statesPakistanPalauPanamaPapua New GuineaParaguayPeruPhilippinesPolandPortugalPost-demographic dividendPre-demographic dividendQatarRomaniaRussian FederationRwandaSamoaSao Tome and PrincipeSaudi ArabiaSenegalSerbiaSeychellesSierra LeoneSingaporeSint Maarten (Dutch part)Slovak RepublicSloveniaSmall statesSolomon IslandsSouth AfricaSouth AsiaSouth Asia (IDA & IBRD)South SudanSpainSri LankaSt. Kitts and NevisSt. LuciaSt. Vincent and the GrenadinesSub-Saharan Africa Sub-Saharan Africa (excluding high income)Sub-Saharan Africa (IDA & IBRD countries)SudanSurinameSwazilandSwedenSwitzerlandSyrian Arab RepublicTajikistanTanzaniaThailandTimor-LesteTogoTongaTrinidad and TobagoTunisiaTurkeyTuvaluUgandaUkraineUnited KingdomUnited StatesUpper middle incomeUruguayVanuatuVenezuela, RBWest Bank and GazaWorldYemen, Rep.ZambiaZimbabwe Timeline:
This timeline shows a graph from 1983 to 2016 of Hungary. No data until 1982. Number of actual observations by date: 34.
Source name:
World Development Indicators
Source organization:
International Monetary Fund, Balance of Payments Statistics Yearbook and data files.
Categories, topics:
Private Sector, Trade
Last updated:
apr 23, 2017
Indicators value changes by year
Maximum:
64.207
jan 1, 1983
At the date of observation
Value
Absolute change
Change from previous value
jan 1, 1983
64.207
+64.207
0.0%
jan 1, 1984
59.599
-4.608
-7.18%
jan 1, 1985
52.777
-6.822
-11.45%
jan 1, 1986
43.872
-8.905
-16.87%
jan 1, 1987
51.541
+7.669
17.48%
jan 1, 1988
53.859
+2.317
4.5%
jan 1, 1989
34.453
-19.406
-36.03%
jan 1, 1990
25.691
-8.762
-25.43%
jan 1, 1991
8.817
-16.874
-65.68%
jan 1, 1992
6.828
-1.989
-22.56%
jan 1, 1993
4.796
-2.031
-29.75%
jan 1, 1994
6.363
+1.567
32.67%
jan 1, 1995
7.293
+0.93
14.61%
jan 1, 1996
12.563
+5.27
72.26%
jan 1, 1997
11.064
-1.499
-11.93%
jan 1, 1998
14.058
+2.994
27.06%
jan 1, 1999
14.539
+0.481
3.42%
jan 1, 2000
14.317
-0.223
-1.53%
jan 1, 2001
14.902
+0.585
4.09%
jan 1, 2002
13.505
-1.396
-9.37%
jan 1, 2003
15.424
+1.919
14.21%
jan 1, 2004
15.216
-0.208
-1.35%
jan 1, 2005
15.46
+0.243
1.6%
jan 1, 2006
19.939
+4.479
28.97%
jan 1, 2007
21.147
+1.208
6.06%
jan 1, 2008
20.063
-1.083
-5.12%
jan 1, 2009
19.988
-0.075
-0.37%
jan 1, 2010
17.27
-2.718
-13.6%
jan 1, 2011
20.69
+3.42
19.8%
jan 1, 2012
21.397
+0.707
3.42%
jan 1, 2013
23.535
+2.137
9.99%
jan 1, 2014
22.927
-0.607
-2.58%
jan 1, 2015
24.399
+1.472
6.42%
jan 1, 2016
24.553
+0.154
0.63%
Ranking of countries by current statistics by years


Comments: