29
/
en
AIzaSyAYiBZKx7MnpbEhh9jyipgxe19OcubqV5w
April 1, 2024
49698
Middle East & North Africa (excluding high income)
MNA
false
2
1
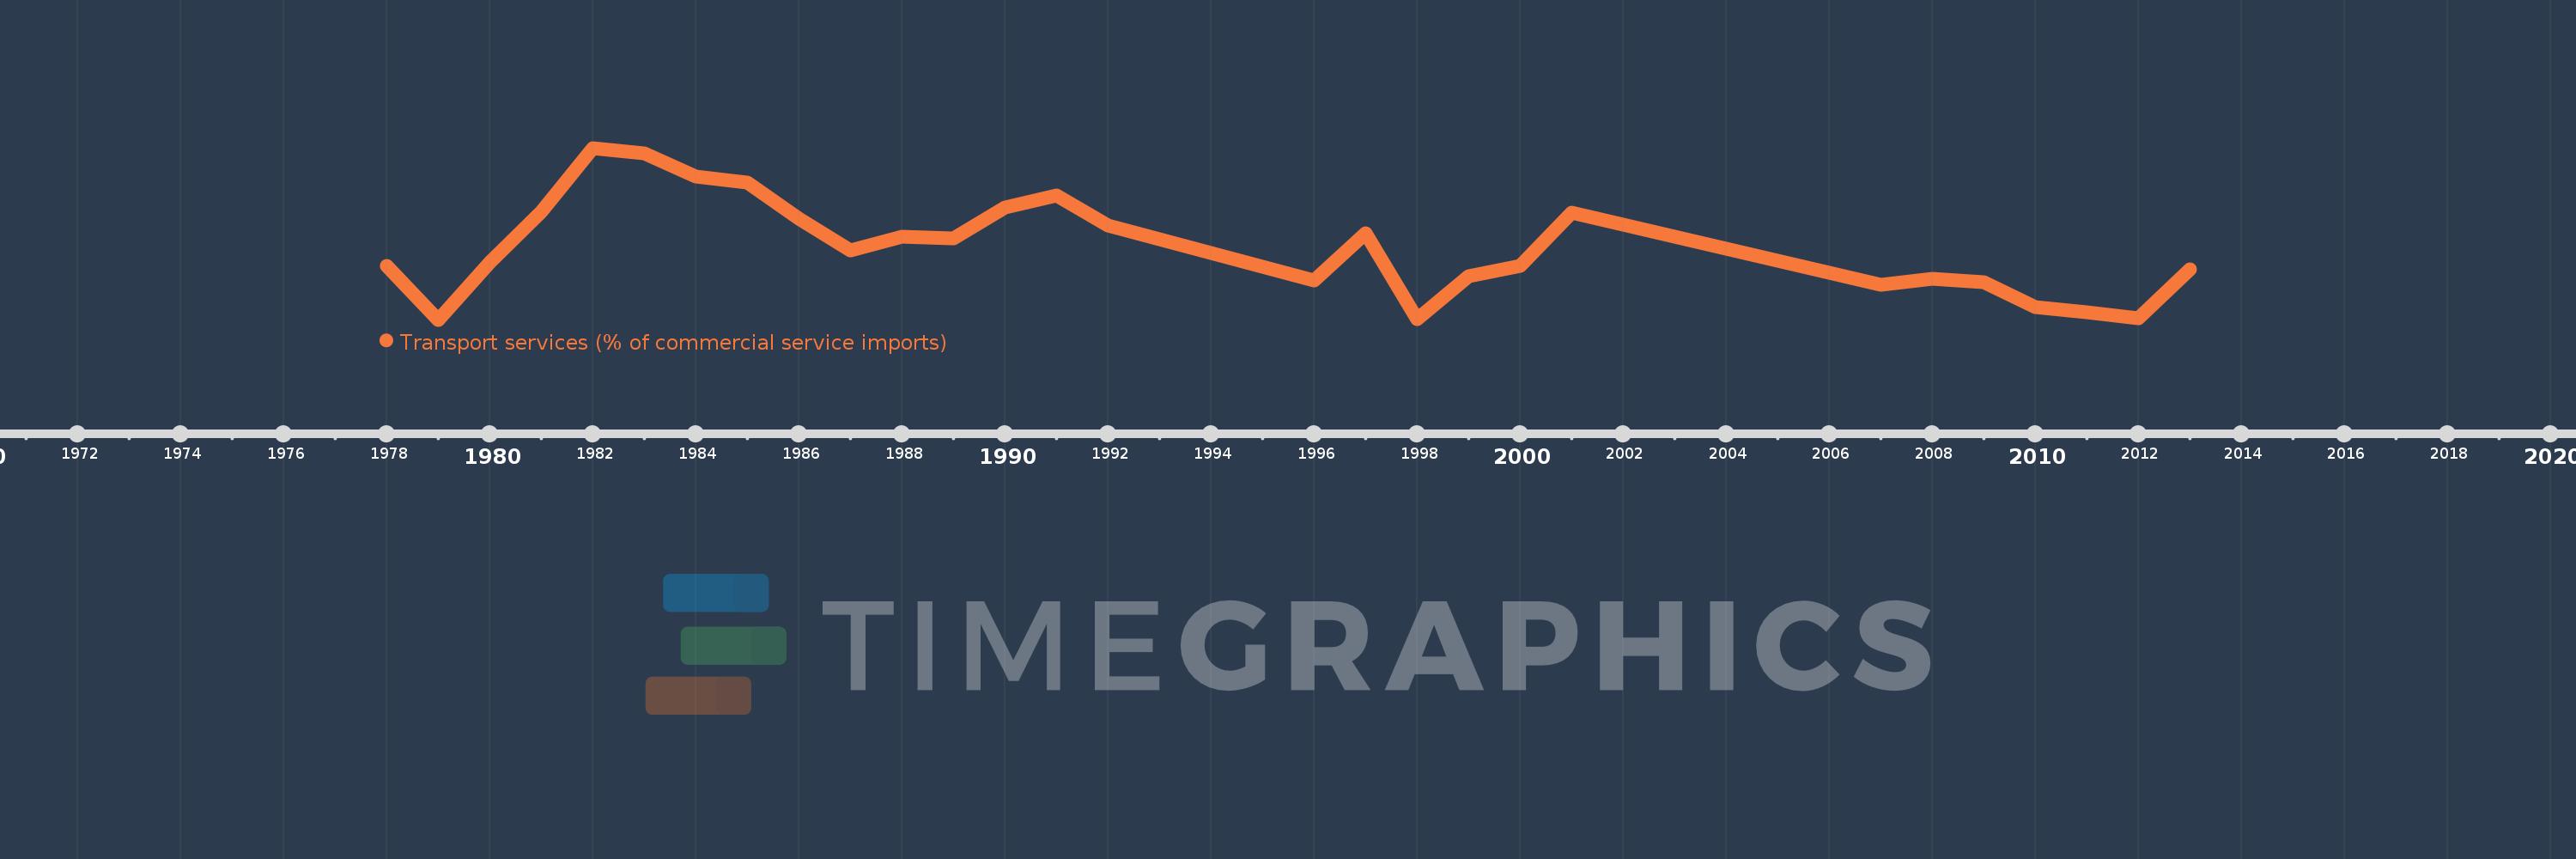
Transport services (% of commercial service imports)
2013,2012,2011,2010,2009,2008,2007,2006,2001,2000,1999,1998,1997,1996,1992,1991,1990,1989,1988,1987,1986,1985,1984,1983,1982,1981,1980,1979,1978
This statistics in other country:
AfghanistanAlbaniaAlgeriaAngolaAntigua and BarbudaArab WorldArgentinaArmeniaArubaAustraliaAustriaAzerbaijanBahamas, TheBahrainBangladeshBarbadosBelarusBelgiumBelizeBeninBermudaBhutanBoliviaBosnia and HerzegovinaBotswanaBrazilBrunei DarussalamBulgariaBurkina FasoBurundiCabo VerdeCambodiaCameroonCanadaCaribbean small statesCentral African RepublicCentral Europe and the BalticsChadChileChinaColombiaComorosCongo, Dem. Rep.Congo, Rep.Costa RicaCote d'IvoireCroatiaCuracaoCyprusCzech RepublicDenmarkDjiboutiDominicaDominican RepublicEarly-demographic dividendEast Asia & PacificEast Asia & Pacific (excluding high income)East Asia & Pacific (IDA & IBRD countries)EcuadorEgypt, Arab Rep.El SalvadorEquatorial GuineaEritreaEstoniaEthiopiaEuro areaEurope & Central AsiaEurope & Central Asia (excluding high income)Europe & Central Asia (IDA & IBRD countries)European UnionFaroe IslandsFijiFinlandFragile and conflict affected situationsFranceFrench PolynesiaGabonGambia, TheGeorgiaGermanyGhanaGreeceGrenadaGuatemalaGuineaGuinea-BissauGuyanaHaitiHeavily indebted poor countries (HIPC)High incomeHondurasHong Kong SAR, ChinaHungaryIBRD onlyIcelandIDA & IBRD totalIDA onlyIDA totalIndiaIndonesiaIran, Islamic Rep.IraqIrelandIsraelItalyJamaicaJapanJordanKazakhstanKenyaKiribatiKorea, Rep.KosovoKuwaitKyrgyz RepublicLao PDRLate-demographic dividendLatin America & Caribbean Latin America & Caribbean (excluding high income)Latin America & the Caribbean (IDA & IBRD countries)LatviaLeast developed countries: UN classificationLebanonLesothoLiberiaLibyaLithuaniaLow & middle incomeLow incomeLower middle incomeLuxembourgMacao SAR, ChinaMacedonia, FYRMadagascarMalawiMalaysiaMaldivesMaliMaltaMarshall IslandsMauritaniaMauritiusMexicoMicronesia, Fed. Sts.Middle East & North AfricaMiddle East & North Africa (excluding high income)Middle East & North Africa (IDA & IBRD countries)Middle incomeMoldovaMongoliaMontenegroMoroccoMozambiqueMyanmarNamibiaNepalNetherlandsNew CaledoniaNew ZealandNicaraguaNigerNigeriaNorth AmericaNorwayOECD membersOmanOther small statesPacific island small statesPakistanPalauPanamaPapua New GuineaParaguayPeruPhilippinesPolandPortugalPost-demographic dividendPre-demographic dividendQatarRomaniaRussian FederationRwandaSamoaSao Tome and PrincipeSaudi ArabiaSenegalSerbiaSeychellesSierra LeoneSingaporeSint Maarten (Dutch part)Slovak RepublicSloveniaSmall statesSolomon IslandsSouth AfricaSouth AsiaSouth Asia (IDA & IBRD)South SudanSpainSri LankaSt. Kitts and NevisSt. LuciaSt. Vincent and the GrenadinesSub-Saharan Africa Sub-Saharan Africa (excluding high income)Sub-Saharan Africa (IDA & IBRD countries)SudanSurinameSwazilandSwedenSwitzerlandSyrian Arab RepublicTajikistanTanzaniaThailandTimor-LesteTogoTongaTrinidad and TobagoTunisiaTurkeyTuvaluUgandaUkraineUnited KingdomUnited StatesUpper middle incomeUruguayVanuatuVenezuela, RBWest Bank and GazaWorldYemen, Rep.ZambiaZimbabwe Timeline:
This timeline shows a graph from 1978 to 2013 of Middle East & North Africa (excluding high income). No data until 1977. Number of actual observations by date: 29.
Source name:
World Development Indicators
Source organization:
International Monetary Fund, Balance of Payments Statistics Yearbook and data files.
Categories, topics:
Private Sector, Trade
Last updated:
apr 23, 2017
Indicators value changes by year
Minimum:
42.632
jan 1, 1979
Maximum:
53.327
jan 1, 1982
At the date of observation
Value
Absolute change
Change from previous value
jan 1, 1978
45.959
+45.959
0.0%
jan 1, 1979
42.632
-3.327
-7.24%
jan 1, 1980
46.202
+3.57
8.37%
jan 1, 1981
49.341
+3.14
6.8%
jan 1, 1982
53.327
+3.986
8.08%
jan 1, 1983
52.985
-0.342
-0.64%
jan 1, 1984
51.548
-1.437
-2.71%
jan 1, 1985
51.158
-0.39
-0.76%
jan 1, 1986
48.914
-2.244
-4.39%
jan 1, 1987
46.939
-1.975
-4.04%
jan 1, 1988
47.808
+0.869
1.85%
jan 1, 1989
47.71
-0.098
-0.21%
jan 1, 1990
49.615
+1.906
3.99%
jan 1, 1991
50.388
+0.773
1.56%
jan 1, 1992
48.498
-1.89
-3.75%
jan 1, 1996
45.051
-3.447
-7.11%
jan 1, 1997
48.029
+2.978
6.61%
jan 1, 1998
42.667
-5.363
-11.17%
jan 1, 1999
45.348
+2.682
6.29%
jan 1, 2000
46.009
+0.661
1.46%
jan 1, 2001
49.274
+3.265
7.1%
jan 1, 2006
45.573
-3.701
-7.51%
jan 1, 2007
44.833
-0.74
-1.62%
jan 1, 2008
45.181
+0.348
0.78%
jan 1, 2009
44.974
-0.207
-0.46%
jan 1, 2010
43.423
-1.551
-3.45%
jan 1, 2011
43.12
-0.303
-0.7%
jan 1, 2012
42.741
-0.379
-0.88%
jan 1, 2013
45.794
+3.052
7.14%
Ranking of countries by current statistics by years


Comments: