29
/
en
AIzaSyAYiBZKx7MnpbEhh9jyipgxe19OcubqV5w
April 1, 2024
26982
Early-demographic dividend
EAR
false
2
1
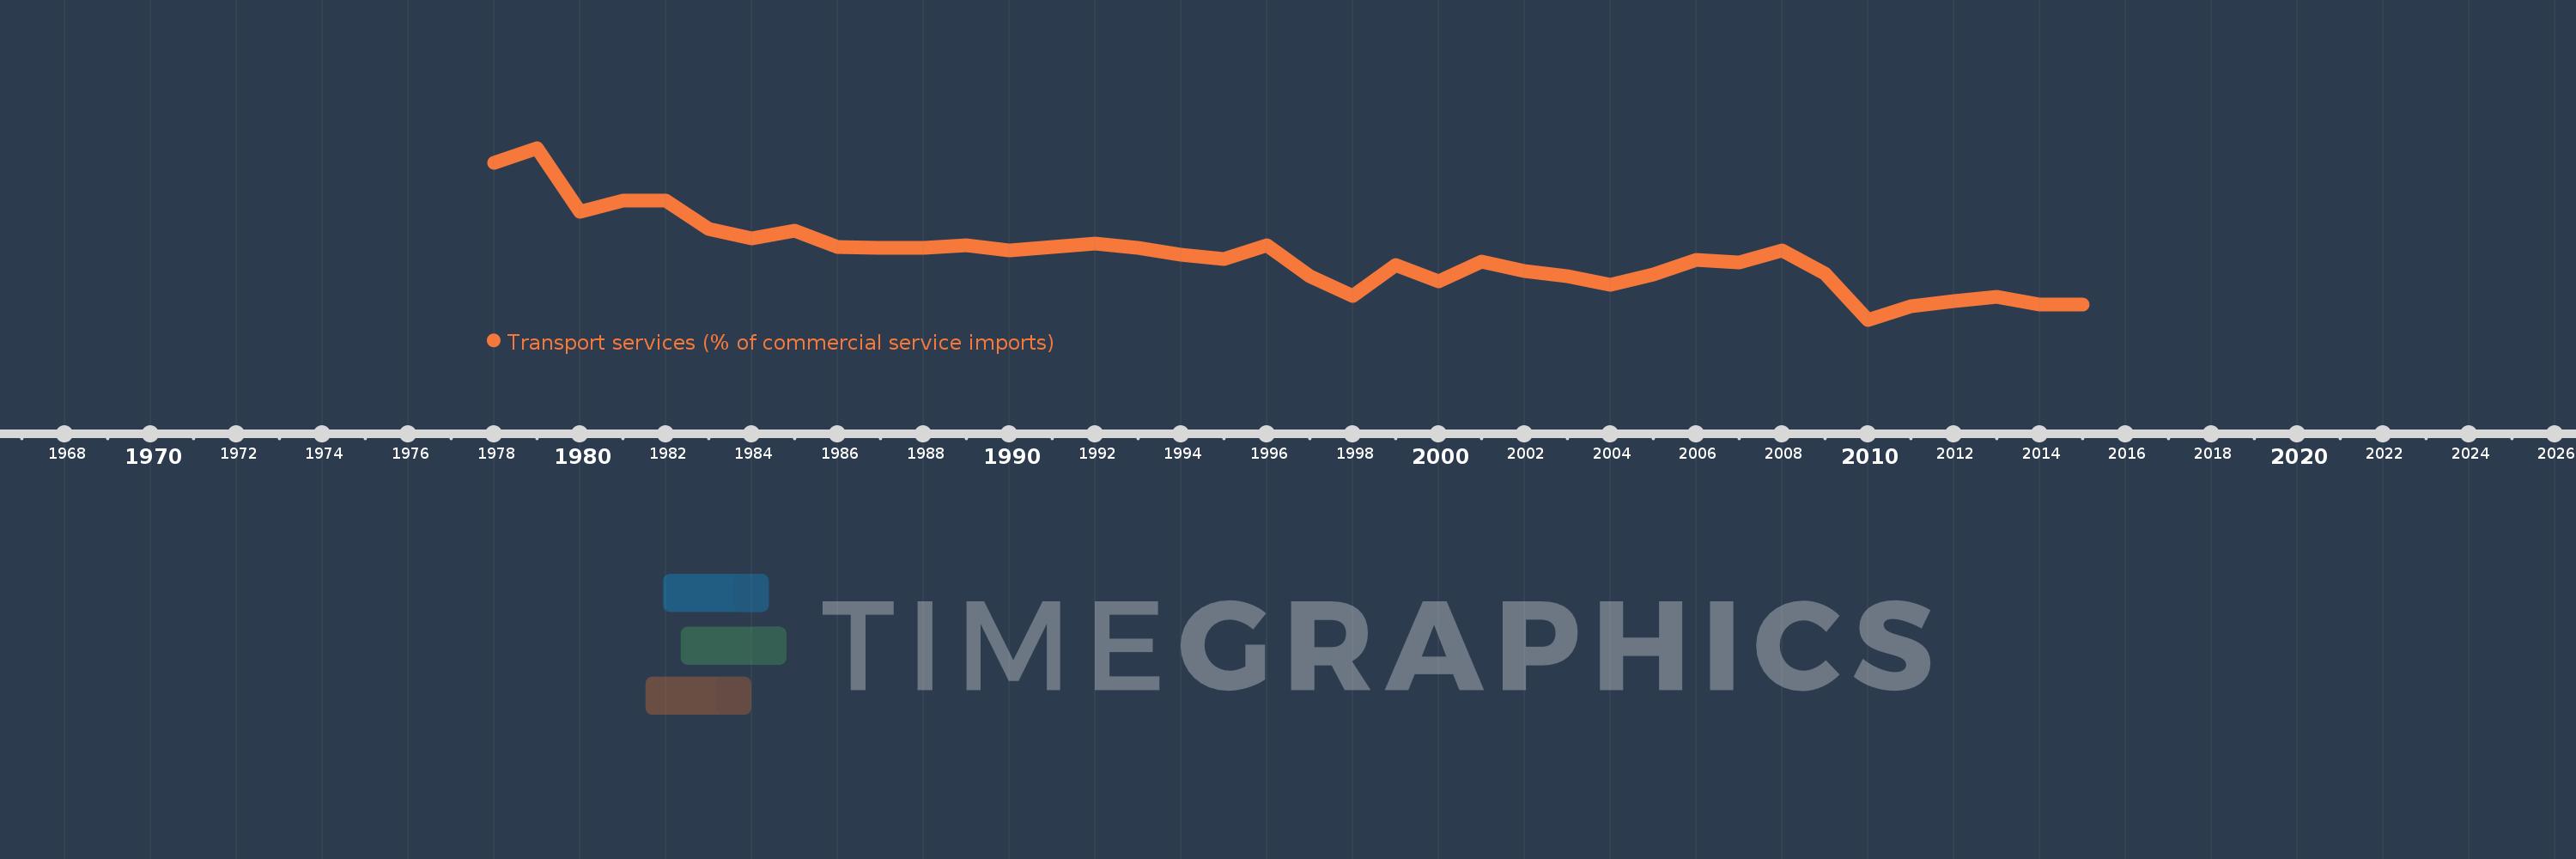
Transport services (% of commercial service imports)
2015,2014,2013,2012,2011,2010,2009,2008,2007,2006,2005,2004,2003,2002,2001,2000,1999,1998,1997,1996,1995,1994,1993,1992,1991,1990,1989,1988,1987,1986,1985,1984,1983,1982,1981,1980,1979,1978
This statistics in other country:
AfghanistanAlbaniaAlgeriaAngolaAntigua and BarbudaArab WorldArgentinaArmeniaArubaAustraliaAustriaAzerbaijanBahamas, TheBahrainBangladeshBarbadosBelarusBelgiumBelizeBeninBermudaBhutanBoliviaBosnia and HerzegovinaBotswanaBrazilBrunei DarussalamBulgariaBurkina FasoBurundiCabo VerdeCambodiaCameroonCanadaCaribbean small statesCentral African RepublicCentral Europe and the BalticsChadChileChinaColombiaComorosCongo, Dem. Rep.Congo, Rep.Costa RicaCote d'IvoireCroatiaCuracaoCyprusCzech RepublicDenmarkDjiboutiDominicaDominican RepublicEarly-demographic dividendEast Asia & PacificEast Asia & Pacific (excluding high income)East Asia & Pacific (IDA & IBRD countries)EcuadorEgypt, Arab Rep.El SalvadorEquatorial GuineaEritreaEstoniaEthiopiaEuro areaEurope & Central AsiaEurope & Central Asia (excluding high income)Europe & Central Asia (IDA & IBRD countries)European UnionFaroe IslandsFijiFinlandFragile and conflict affected situationsFranceFrench PolynesiaGabonGambia, TheGeorgiaGermanyGhanaGreeceGrenadaGuatemalaGuineaGuinea-BissauGuyanaHaitiHeavily indebted poor countries (HIPC)High incomeHondurasHong Kong SAR, ChinaHungaryIBRD onlyIcelandIDA & IBRD totalIDA onlyIDA totalIndiaIndonesiaIran, Islamic Rep.IraqIrelandIsraelItalyJamaicaJapanJordanKazakhstanKenyaKiribatiKorea, Rep.KosovoKuwaitKyrgyz RepublicLao PDRLate-demographic dividendLatin America & Caribbean Latin America & Caribbean (excluding high income)Latin America & the Caribbean (IDA & IBRD countries)LatviaLeast developed countries: UN classificationLebanonLesothoLiberiaLibyaLithuaniaLow & middle incomeLow incomeLower middle incomeLuxembourgMacao SAR, ChinaMacedonia, FYRMadagascarMalawiMalaysiaMaldivesMaliMaltaMarshall IslandsMauritaniaMauritiusMexicoMicronesia, Fed. Sts.Middle East & North AfricaMiddle East & North Africa (excluding high income)Middle East & North Africa (IDA & IBRD countries)Middle incomeMoldovaMongoliaMontenegroMoroccoMozambiqueMyanmarNamibiaNepalNetherlandsNew CaledoniaNew ZealandNicaraguaNigerNigeriaNorth AmericaNorwayOECD membersOmanOther small statesPacific island small statesPakistanPalauPanamaPapua New GuineaParaguayPeruPhilippinesPolandPortugalPost-demographic dividendPre-demographic dividendQatarRomaniaRussian FederationRwandaSamoaSao Tome and PrincipeSaudi ArabiaSenegalSerbiaSeychellesSierra LeoneSingaporeSint Maarten (Dutch part)Slovak RepublicSloveniaSmall statesSolomon IslandsSouth AfricaSouth AsiaSouth Asia (IDA & IBRD)South SudanSpainSri LankaSt. Kitts and NevisSt. LuciaSt. Vincent and the GrenadinesSub-Saharan Africa Sub-Saharan Africa (excluding high income)Sub-Saharan Africa (IDA & IBRD countries)SudanSurinameSwazilandSwedenSwitzerlandSyrian Arab RepublicTajikistanTanzaniaThailandTimor-LesteTogoTongaTrinidad and TobagoTunisiaTurkeyTuvaluUgandaUkraineUnited KingdomUnited StatesUpper middle incomeUruguayVanuatuVenezuela, RBWest Bank and GazaWorldYemen, Rep.ZambiaZimbabwe Timeline:
This timeline shows a graph from 1978 to 2015 of Early-demographic dividend. No data until 1977. Number of actual observations by date: 38.
Source name:
World Development Indicators
Source organization:
International Monetary Fund, Balance of Payments Statistics Yearbook and data files.
Categories, topics:
Private Sector, Trade
Last updated:
apr 23, 2017
Indicators value changes by year
Minimum:
34.144
jan 1, 2010
Maximum:
54.193
jan 1, 1979
At the date of observation
Value
Absolute change
Change from previous value
jan 1, 1978
52.481
+52.481
0.0%
jan 1, 1979
54.193
+1.712
3.26%
jan 1, 1980
46.719
-7.474
-13.79%
jan 1, 1981
48.087
+1.368
2.93%
jan 1, 1982
48.098
+0.011
0.02%
jan 1, 1983
44.78
-3.318
-6.9%
jan 1, 1984
43.686
-1.094
-2.44%
jan 1, 1985
44.511
+0.825
1.89%
jan 1, 1986
42.618
-1.893
-4.25%
jan 1, 1987
42.55
-0.068
-0.16%
jan 1, 1988
42.491
-0.059
-0.14%
jan 1, 1989
42.794
+0.303
0.71%
jan 1, 1990
42.197
-0.596
-1.39%
jan 1, 1991
42.662
+0.464
1.1%
jan 1, 1992
42.997
+0.335
0.79%
jan 1, 1993
42.566
-0.431
-1.0%
jan 1, 1994
41.716
-0.85
-2.0%
jan 1, 1995
41.251
-0.465
-1.11%
jan 1, 1996
42.865
+1.614
3.91%
jan 1, 1997
39.248
-3.617
-8.44%
jan 1, 1998
36.969
-2.279
-5.81%
jan 1, 1999
40.536
+3.567
9.65%
jan 1, 2000
38.642
-1.894
-4.67%
jan 1, 2001
40.905
+2.263
5.86%
jan 1, 2002
39.852
-1.053
-2.57%
jan 1, 2003
39.249
-0.603
-1.51%
jan 1, 2004
38.178
-1.071
-2.73%
jan 1, 2005
39.445
+1.267
3.32%
jan 1, 2006
41.123
+1.678
4.26%
jan 1, 2007
40.848
-0.275
-0.67%
jan 1, 2008
42.259
+1.411
3.45%
jan 1, 2009
39.479
-2.78
-6.58%
jan 1, 2010
34.144
-5.335
-13.51%
jan 1, 2011
35.715
+1.571
4.6%
jan 1, 2012
36.353
+0.638
1.79%
jan 1, 2013
36.827
+0.475
1.31%
jan 1, 2014
35.955
-0.873
-2.37%
jan 1, 2015
35.898
-0.057
-0.16%
Ranking of countries by current statistics by years


Comments: