29
/
en
AIzaSyAYiBZKx7MnpbEhh9jyipgxe19OcubqV5w
April 1, 2024
225495
Poland
POL
true
2
1
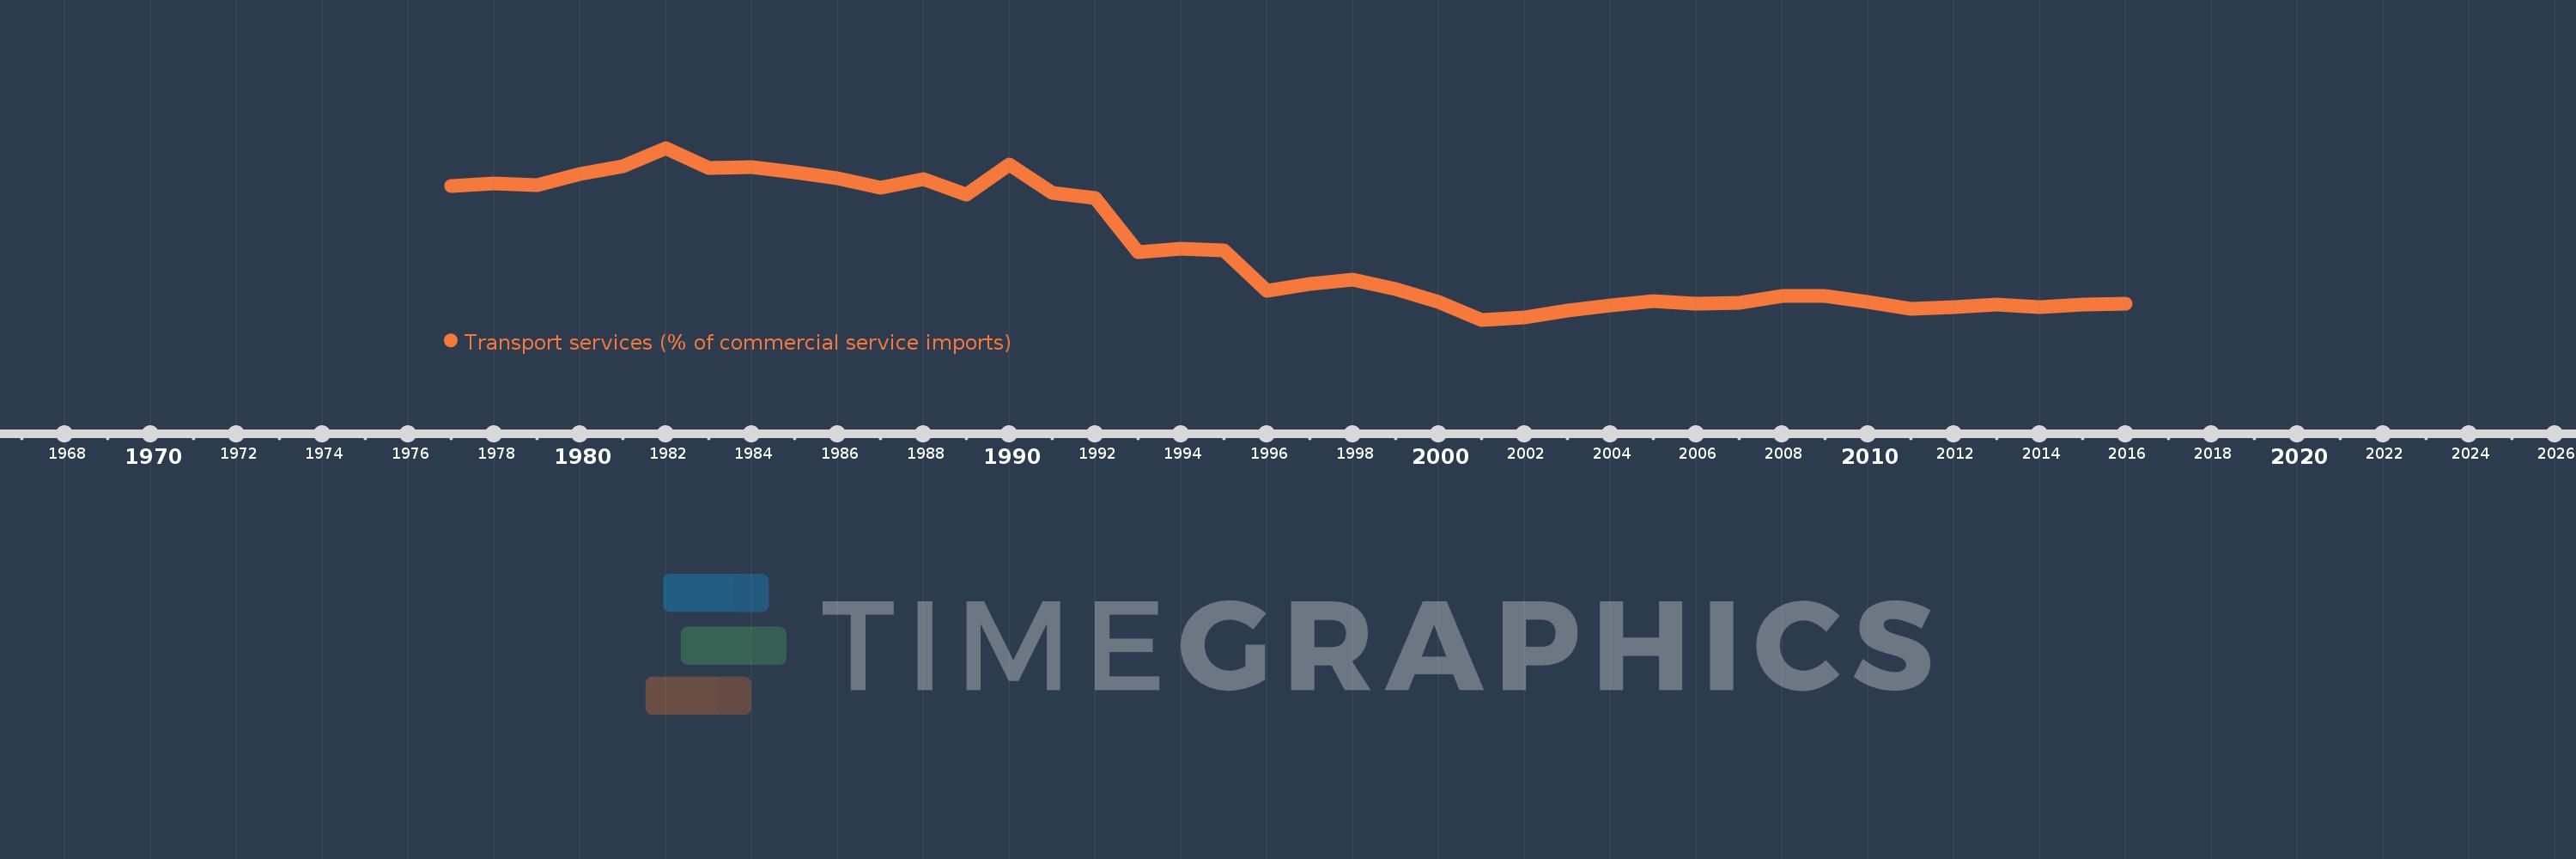
Transport services (% of commercial service imports)
2016,2015,2014,2013,2012,2011,2010,2009,2008,2007,2006,2005,2004,2003,2002,2001,2000,1999,1998,1997,1996,1995,1994,1993,1992,1991,1990,1989,1988,1987,1986,1985,1984,1983,1982,1981,1980,1979,1978,1977
This statistics in other country:
AfghanistanAlbaniaAlgeriaAngolaAntigua and BarbudaArab WorldArgentinaArmeniaArubaAustraliaAustriaAzerbaijanBahamas, TheBahrainBangladeshBarbadosBelarusBelgiumBelizeBeninBermudaBhutanBoliviaBosnia and HerzegovinaBotswanaBrazilBrunei DarussalamBulgariaBurkina FasoBurundiCabo VerdeCambodiaCameroonCanadaCaribbean small statesCentral African RepublicCentral Europe and the BalticsChadChileChinaColombiaComorosCongo, Dem. Rep.Congo, Rep.Costa RicaCote d'IvoireCroatiaCuracaoCyprusCzech RepublicDenmarkDjiboutiDominicaDominican RepublicEarly-demographic dividendEast Asia & PacificEast Asia & Pacific (excluding high income)East Asia & Pacific (IDA & IBRD countries)EcuadorEgypt, Arab Rep.El SalvadorEquatorial GuineaEritreaEstoniaEthiopiaEuro areaEurope & Central AsiaEurope & Central Asia (excluding high income)Europe & Central Asia (IDA & IBRD countries)European UnionFaroe IslandsFijiFinlandFragile and conflict affected situationsFranceFrench PolynesiaGabonGambia, TheGeorgiaGermanyGhanaGreeceGrenadaGuatemalaGuineaGuinea-BissauGuyanaHaitiHeavily indebted poor countries (HIPC)High incomeHondurasHong Kong SAR, ChinaHungaryIBRD onlyIcelandIDA & IBRD totalIDA onlyIDA totalIndiaIndonesiaIran, Islamic Rep.IraqIrelandIsraelItalyJamaicaJapanJordanKazakhstanKenyaKiribatiKorea, Rep.KosovoKuwaitKyrgyz RepublicLao PDRLate-demographic dividendLatin America & Caribbean Latin America & Caribbean (excluding high income)Latin America & the Caribbean (IDA & IBRD countries)LatviaLeast developed countries: UN classificationLebanonLesothoLiberiaLibyaLithuaniaLow & middle incomeLow incomeLower middle incomeLuxembourgMacao SAR, ChinaMacedonia, FYRMadagascarMalawiMalaysiaMaldivesMaliMaltaMarshall IslandsMauritaniaMauritiusMexicoMicronesia, Fed. Sts.Middle East & North AfricaMiddle East & North Africa (excluding high income)Middle East & North Africa (IDA & IBRD countries)Middle incomeMoldovaMongoliaMontenegroMoroccoMozambiqueMyanmarNamibiaNepalNetherlandsNew CaledoniaNew ZealandNicaraguaNigerNigeriaNorth AmericaNorwayOECD membersOmanOther small statesPacific island small statesPakistanPalauPanamaPapua New GuineaParaguayPeruPhilippinesPolandPortugalPost-demographic dividendPre-demographic dividendQatarRomaniaRussian FederationRwandaSamoaSao Tome and PrincipeSaudi ArabiaSenegalSerbiaSeychellesSierra LeoneSingaporeSint Maarten (Dutch part)Slovak RepublicSloveniaSmall statesSolomon IslandsSouth AfricaSouth AsiaSouth Asia (IDA & IBRD)South SudanSpainSri LankaSt. Kitts and NevisSt. LuciaSt. Vincent and the GrenadinesSub-Saharan Africa Sub-Saharan Africa (excluding high income)Sub-Saharan Africa (IDA & IBRD countries)SudanSurinameSwazilandSwedenSwitzerlandSyrian Arab RepublicTajikistanTanzaniaThailandTimor-LesteTogoTongaTrinidad and TobagoTunisiaTurkeyTuvaluUgandaUkraineUnited KingdomUnited StatesUpper middle incomeUruguayVanuatuVenezuela, RBWest Bank and GazaWorldYemen, Rep.ZambiaZimbabwe Timeline:
This timeline shows a graph from 1977 to 2016 of Poland. No data until 1976. Number of actual observations by date: 40.
Source name:
World Development Indicators
Source organization:
International Monetary Fund, Balance of Payments Statistics Yearbook and data files.
Categories, topics:
Private Sector, Trade
Last updated:
apr 23, 2017
Indicators value changes by year
Minimum:
17.285
jan 1, 2001
Maximum:
64.858
jan 1, 1982
At the date of observation
Value
Absolute change
Change from previous value
jan 1, 1977
54.423
+54.423
0.0%
jan 1, 1978
55.019
+0.596
1.1%
jan 1, 1979
54.648
-0.371
-0.67%
jan 1, 1980
57.697
+3.049
5.58%
jan 1, 1981
59.871
+2.174
3.77%
jan 1, 1982
64.858
+4.987
8.33%
jan 1, 1983
59.4
-5.458
-8.42%
jan 1, 1984
59.478
+0.078
0.13%
jan 1, 1985
58.009
-1.47
-2.47%
jan 1, 1986
56.511
-1.497
-2.58%
jan 1, 1987
53.738
-2.774
-4.91%
jan 1, 1988
56.321
+2.584
4.81%
jan 1, 1989
51.843
-4.479
-7.95%
jan 1, 1990
60.364
+8.521
16.44%
jan 1, 1991
52.388
-7.975
-13.21%
jan 1, 1992
50.939
-1.45
-2.77%
jan 1, 1993
35.891
-15.047
-29.54%
jan 1, 1994
36.891
+0.999
2.78%
jan 1, 1995
36.439
-0.452
-1.22%
jan 1, 1996
25.228
-11.211
-30.77%
jan 1, 1997
27.136
+1.907
7.56%
jan 1, 1998
28.342
+1.207
4.45%
jan 1, 1999
25.668
-2.675
-9.44%
jan 1, 2000
22.29
-3.377
-13.16%
jan 1, 2001
17.285
-5.005
-22.45%
jan 1, 2002
17.856
+0.571
3.3%
jan 1, 2003
19.847
+1.991
11.15%
jan 1, 2004
21.24
+1.392
7.02%
jan 1, 2005
22.355
+1.116
5.25%
jan 1, 2006
21.677
-0.678
-3.03%
jan 1, 2007
21.884
+0.207
0.95%
jan 1, 2008
23.833
+1.949
8.91%
jan 1, 2009
23.825
-0.008
-0.03%
jan 1, 2010
22.249
-1.576
-6.61%
jan 1, 2011
20.265
-1.984
-8.92%
jan 1, 2012
20.784
+0.519
2.56%
jan 1, 2013
21.556
+0.773
3.72%
jan 1, 2014
20.82
-0.736
-3.41%
jan 1, 2015
21.535
+0.714
3.43%
jan 1, 2016
21.725
+0.191
0.88%
Ranking of countries by current statistics by years


Comments: