29
/
en
AIzaSyAYiBZKx7MnpbEhh9jyipgxe19OcubqV5w
April 1, 2024
100715
Cameroon
CMR
true
2
1
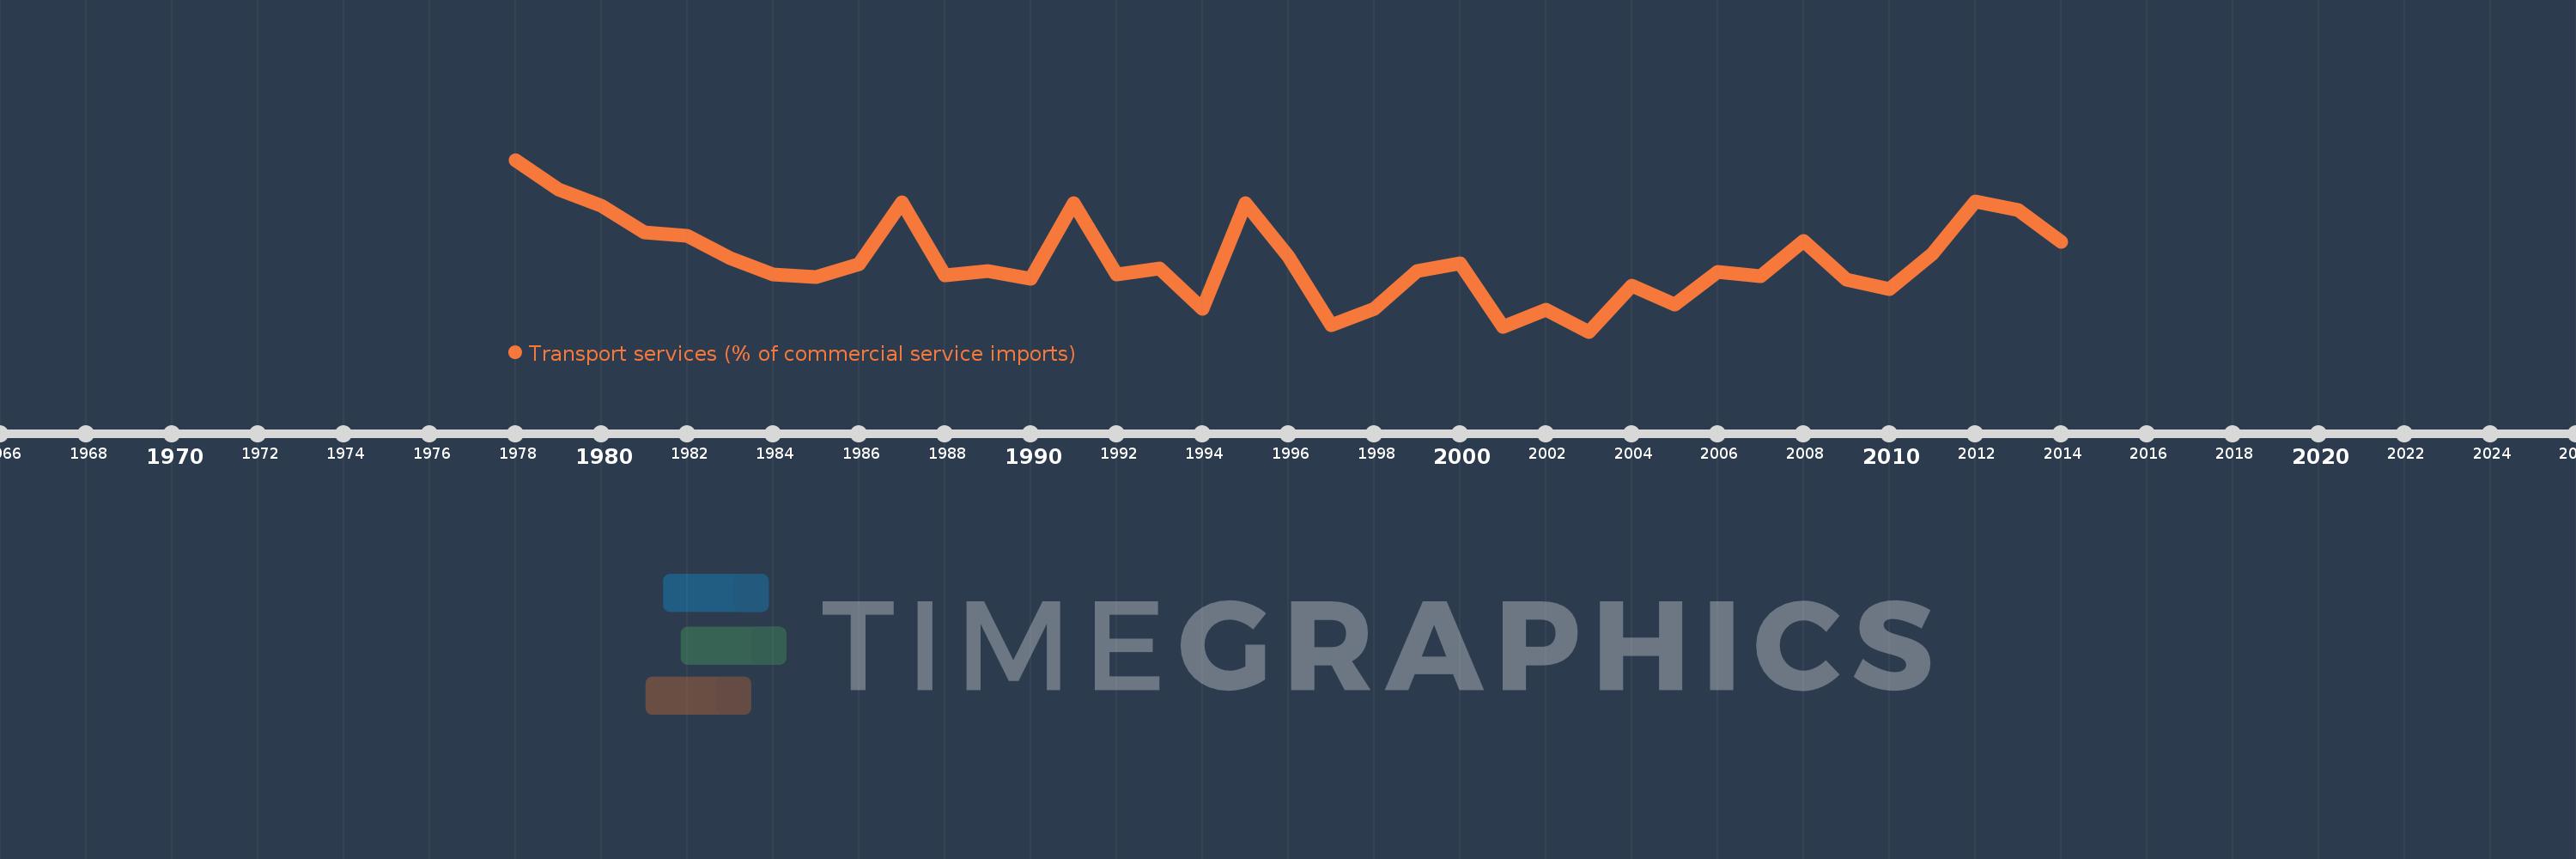
Transport services (% of commercial service imports)
2014,2013,2012,2011,2010,2009,2008,2007,2006,2005,2004,2003,2002,2001,2000,1999,1998,1997,1996,1995,1994,1993,1992,1991,1990,1989,1988,1987,1986,1985,1984,1983,1982,1981,1980,1979,1978
This statistics in other country:
AfghanistanAlbaniaAlgeriaAngolaAntigua and BarbudaArab WorldArgentinaArmeniaArubaAustraliaAustriaAzerbaijanBahamas, TheBahrainBangladeshBarbadosBelarusBelgiumBelizeBeninBermudaBhutanBoliviaBosnia and HerzegovinaBotswanaBrazilBrunei DarussalamBulgariaBurkina FasoBurundiCabo VerdeCambodiaCameroonCanadaCaribbean small statesCentral African RepublicCentral Europe and the BalticsChadChileChinaColombiaComorosCongo, Dem. Rep.Congo, Rep.Costa RicaCote d'IvoireCroatiaCuracaoCyprusCzech RepublicDenmarkDjiboutiDominicaDominican RepublicEarly-demographic dividendEast Asia & PacificEast Asia & Pacific (excluding high income)East Asia & Pacific (IDA & IBRD countries)EcuadorEgypt, Arab Rep.El SalvadorEquatorial GuineaEritreaEstoniaEthiopiaEuro areaEurope & Central AsiaEurope & Central Asia (excluding high income)Europe & Central Asia (IDA & IBRD countries)European UnionFaroe IslandsFijiFinlandFragile and conflict affected situationsFranceFrench PolynesiaGabonGambia, TheGeorgiaGermanyGhanaGreeceGrenadaGuatemalaGuineaGuinea-BissauGuyanaHaitiHeavily indebted poor countries (HIPC)High incomeHondurasHong Kong SAR, ChinaHungaryIBRD onlyIcelandIDA & IBRD totalIDA onlyIDA totalIndiaIndonesiaIran, Islamic Rep.IraqIrelandIsraelItalyJamaicaJapanJordanKazakhstanKenyaKiribatiKorea, Rep.KosovoKuwaitKyrgyz RepublicLao PDRLate-demographic dividendLatin America & Caribbean Latin America & Caribbean (excluding high income)Latin America & the Caribbean (IDA & IBRD countries)LatviaLeast developed countries: UN classificationLebanonLesothoLiberiaLibyaLithuaniaLow & middle incomeLow incomeLower middle incomeLuxembourgMacao SAR, ChinaMacedonia, FYRMadagascarMalawiMalaysiaMaldivesMaliMaltaMarshall IslandsMauritaniaMauritiusMexicoMicronesia, Fed. Sts.Middle East & North AfricaMiddle East & North Africa (excluding high income)Middle East & North Africa (IDA & IBRD countries)Middle incomeMoldovaMongoliaMontenegroMoroccoMozambiqueMyanmarNamibiaNepalNetherlandsNew CaledoniaNew ZealandNicaraguaNigerNigeriaNorth AmericaNorwayOECD membersOmanOther small statesPacific island small statesPakistanPalauPanamaPapua New GuineaParaguayPeruPhilippinesPolandPortugalPost-demographic dividendPre-demographic dividendQatarRomaniaRussian FederationRwandaSamoaSao Tome and PrincipeSaudi ArabiaSenegalSerbiaSeychellesSierra LeoneSingaporeSint Maarten (Dutch part)Slovak RepublicSloveniaSmall statesSolomon IslandsSouth AfricaSouth AsiaSouth Asia (IDA & IBRD)South SudanSpainSri LankaSt. Kitts and NevisSt. LuciaSt. Vincent and the GrenadinesSub-Saharan Africa Sub-Saharan Africa (excluding high income)Sub-Saharan Africa (IDA & IBRD countries)SudanSurinameSwazilandSwedenSwitzerlandSyrian Arab RepublicTajikistanTanzaniaThailandTimor-LesteTogoTongaTrinidad and TobagoTunisiaTurkeyTuvaluUgandaUkraineUnited KingdomUnited StatesUpper middle incomeUruguayVanuatuVenezuela, RBWest Bank and GazaWorldYemen, Rep.ZambiaZimbabwe Timeline:
This timeline shows a graph from 1978 to 2014 of Cameroon. No data until 1977. Number of actual observations by date: 37.
Source name:
World Development Indicators
Source organization:
International Monetary Fund, Balance of Payments Statistics Yearbook and data files.
Categories, topics:
Private Sector, Trade
Last updated:
apr 23, 2017
Indicators value changes by year
Minimum:
21.336
jan 1, 2003
Maximum:
53.434
jan 1, 1978
At the date of observation
Value
Absolute change
Change from previous value
jan 1, 1978
53.434
+53.434
0.0%
jan 1, 1979
47.937
-5.497
-10.29%
jan 1, 1980
44.835
-3.102
-6.47%
jan 1, 1981
39.814
-5.021
-11.2%
jan 1, 1982
39.233
-0.581
-1.46%
jan 1, 1983
35.063
-4.17
-10.63%
jan 1, 1984
32.048
-3.015
-8.6%
jan 1, 1985
31.448
-0.6
-1.87%
jan 1, 1986
33.966
+2.518
8.01%
jan 1, 1987
45.49
+11.525
33.93%
jan 1, 1988
31.797
-13.694
-30.1%
jan 1, 1989
32.674
+0.878
2.76%
jan 1, 1990
31.269
-1.406
-4.3%
jan 1, 1991
45.259
+13.99
44.74%
jan 1, 1992
32.01
-13.249
-29.27%
jan 1, 1993
33.208
+1.198
3.74%
jan 1, 1994
25.518
-7.69
-23.16%
jan 1, 1995
45.253
+19.735
77.34%
jan 1, 1996
35.397
-9.855
-21.78%
jan 1, 1997
22.593
-12.804
-36.17%
jan 1, 1998
25.602
+3.008
13.32%
jan 1, 1999
32.624
+7.022
27.43%
jan 1, 2000
34.109
+1.485
4.55%
jan 1, 2001
22.208
-11.901
-34.89%
jan 1, 2002
25.421
+3.214
14.47%
jan 1, 2003
21.336
-4.086
-16.07%
jan 1, 2004
29.991
+8.656
40.57%
jan 1, 2005
26.462
-3.529
-11.77%
jan 1, 2006
32.543
+6.08
22.98%
jan 1, 2007
31.755
-0.788
-2.42%
jan 1, 2008
38.224
+6.47
20.37%
jan 1, 2009
30.987
-7.237
-18.93%
jan 1, 2010
29.213
-1.774
-5.72%
jan 1, 2011
35.925
+6.712
22.97%
jan 1, 2012
45.589
+9.664
26.9%
jan 1, 2013
44.085
-1.504
-3.3%
jan 1, 2014
38.037
-6.048
-13.72%
Ranking of countries by current statistics by years


Comments: