29
/
en
AIzaSyAYiBZKx7MnpbEhh9jyipgxe19OcubqV5w
April 1, 2024
196392
Mexico
MEX
true
2
1
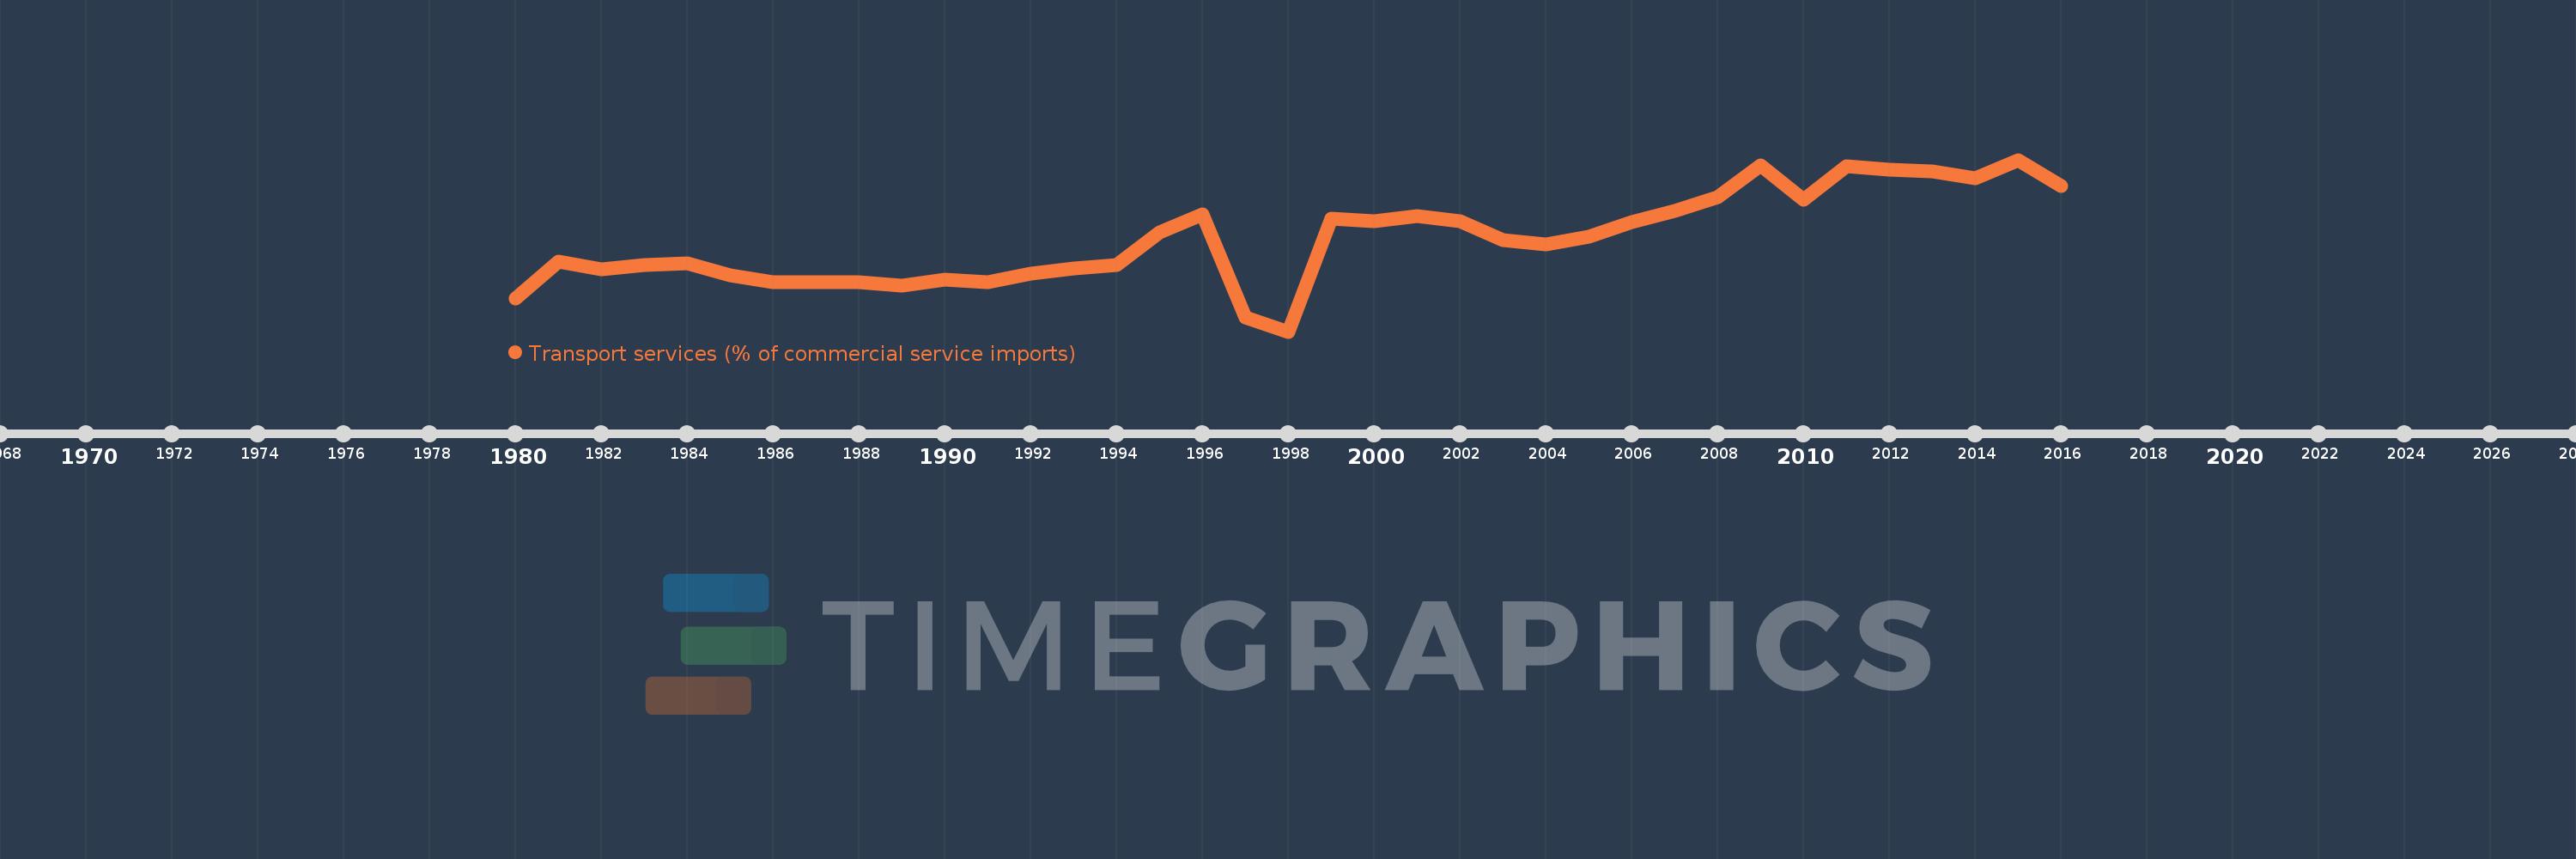
Transport services (% of commercial service imports)
2016,2015,2014,2013,2012,2011,2010,2009,2008,2007,2006,2005,2004,2003,2002,2001,2000,1999,1998,1997,1996,1995,1994,1993,1992,1991,1990,1989,1988,1987,1986,1985,1984,1983,1982,1981,1980
This statistics in other country:
AfghanistanAlbaniaAlgeriaAngolaAntigua and BarbudaArab WorldArgentinaArmeniaArubaAustraliaAustriaAzerbaijanBahamas, TheBahrainBangladeshBarbadosBelarusBelgiumBelizeBeninBermudaBhutanBoliviaBosnia and HerzegovinaBotswanaBrazilBrunei DarussalamBulgariaBurkina FasoBurundiCabo VerdeCambodiaCameroonCanadaCaribbean small statesCentral African RepublicCentral Europe and the BalticsChadChileChinaColombiaComorosCongo, Dem. Rep.Congo, Rep.Costa RicaCote d'IvoireCroatiaCuracaoCyprusCzech RepublicDenmarkDjiboutiDominicaDominican RepublicEarly-demographic dividendEast Asia & PacificEast Asia & Pacific (excluding high income)East Asia & Pacific (IDA & IBRD countries)EcuadorEgypt, Arab Rep.El SalvadorEquatorial GuineaEritreaEstoniaEthiopiaEuro areaEurope & Central AsiaEurope & Central Asia (excluding high income)Europe & Central Asia (IDA & IBRD countries)European UnionFaroe IslandsFijiFinlandFragile and conflict affected situationsFranceFrench PolynesiaGabonGambia, TheGeorgiaGermanyGhanaGreeceGrenadaGuatemalaGuineaGuinea-BissauGuyanaHaitiHeavily indebted poor countries (HIPC)High incomeHondurasHong Kong SAR, ChinaHungaryIBRD onlyIcelandIDA & IBRD totalIDA onlyIDA totalIndiaIndonesiaIran, Islamic Rep.IraqIrelandIsraelItalyJamaicaJapanJordanKazakhstanKenyaKiribatiKorea, Rep.KosovoKuwaitKyrgyz RepublicLao PDRLate-demographic dividendLatin America & Caribbean Latin America & Caribbean (excluding high income)Latin America & the Caribbean (IDA & IBRD countries)LatviaLeast developed countries: UN classificationLebanonLesothoLiberiaLibyaLithuaniaLow & middle incomeLow incomeLower middle incomeLuxembourgMacao SAR, ChinaMacedonia, FYRMadagascarMalawiMalaysiaMaldivesMaliMaltaMarshall IslandsMauritaniaMauritiusMexicoMicronesia, Fed. Sts.Middle East & North AfricaMiddle East & North Africa (excluding high income)Middle East & North Africa (IDA & IBRD countries)Middle incomeMoldovaMongoliaMontenegroMoroccoMozambiqueMyanmarNamibiaNepalNetherlandsNew CaledoniaNew ZealandNicaraguaNigerNigeriaNorth AmericaNorwayOECD membersOmanOther small statesPacific island small statesPakistanPalauPanamaPapua New GuineaParaguayPeruPhilippinesPolandPortugalPost-demographic dividendPre-demographic dividendQatarRomaniaRussian FederationRwandaSamoaSao Tome and PrincipeSaudi ArabiaSenegalSerbiaSeychellesSierra LeoneSingaporeSint Maarten (Dutch part)Slovak RepublicSloveniaSmall statesSolomon IslandsSouth AfricaSouth AsiaSouth Asia (IDA & IBRD)South SudanSpainSri LankaSt. Kitts and NevisSt. LuciaSt. Vincent and the GrenadinesSub-Saharan Africa Sub-Saharan Africa (excluding high income)Sub-Saharan Africa (IDA & IBRD countries)SudanSurinameSwazilandSwedenSwitzerlandSyrian Arab RepublicTajikistanTanzaniaThailandTimor-LesteTogoTongaTrinidad and TobagoTunisiaTurkeyTuvaluUgandaUkraineUnited KingdomUnited StatesUpper middle incomeUruguayVanuatuVenezuela, RBWest Bank and GazaWorldYemen, Rep.ZambiaZimbabwe Timeline:
This timeline shows a graph from 1980 to 2016 of Mexico. No data until 1979. Number of actual observations by date: 37.
Source name:
World Development Indicators
Source organization:
International Monetary Fund, Balance of Payments Statistics Yearbook and data files.
Categories, topics:
Private Sector, Trade
Last updated:
apr 23, 2017
Indicators value changes by year
Minimum:
15.593
jan 1, 1998
Maximum:
48.371
jan 1, 2015
At the date of observation
Value
Absolute change
Change from previous value
jan 1, 1980
21.849
+21.849
0.0%
jan 1, 1981
28.953
+7.104
32.52%
jan 1, 1982
27.46
-1.492
-5.15%
jan 1, 1983
28.349
+0.888
3.24%
jan 1, 1984
28.616
+0.267
0.94%
jan 1, 1985
26.273
-2.344
-8.19%
jan 1, 1986
25.019
-1.254
-4.77%
jan 1, 1987
24.983
-0.036
-0.14%
jan 1, 1988
25.03
+0.047
0.19%
jan 1, 1989
24.372
-0.659
-2.63%
jan 1, 1990
25.57
+1.198
4.92%
jan 1, 1991
24.952
-0.618
-2.42%
jan 1, 1992
26.725
+1.774
7.11%
jan 1, 1993
27.699
+0.973
3.64%
jan 1, 1994
28.255
+0.556
2.01%
jan 1, 1995
34.59
+6.335
22.42%
jan 1, 1996
37.952
+3.362
9.72%
jan 1, 1997
18.246
-19.706
-51.92%
jan 1, 1998
15.593
-2.653
-14.54%
jan 1, 1999
37.222
+21.629
138.71%
jan 1, 2000
36.574
-0.647
-1.74%
jan 1, 2001
37.686
+1.111
3.04%
jan 1, 2002
36.676
-1.01
-2.68%
jan 1, 2003
32.999
-3.677
-10.03%
jan 1, 2004
32.26
-0.738
-2.24%
jan 1, 2005
33.74
+1.479
4.59%
jan 1, 2006
36.464
+2.724
8.07%
jan 1, 2007
38.652
+2.188
6.0%
jan 1, 2008
41.312
+2.66
6.88%
jan 1, 2009
47.287
+5.975
14.46%
jan 1, 2010
40.763
-6.524
-13.8%
jan 1, 2011
47.076
+6.313
15.49%
jan 1, 2012
46.504
-0.572
-1.22%
jan 1, 2013
46.116
-0.388
-0.83%
jan 1, 2014
44.788
-1.328
-2.88%
jan 1, 2015
48.371
+3.583
8.0%
jan 1, 2016
43.444
-4.927
-10.19%
Ranking of countries by current statistics by years


Comments: