29
/
en
AIzaSyAYiBZKx7MnpbEhh9jyipgxe19OcubqV5w
April 1, 2024
68586
Antigua and Barbuda
ATG
true
2
1
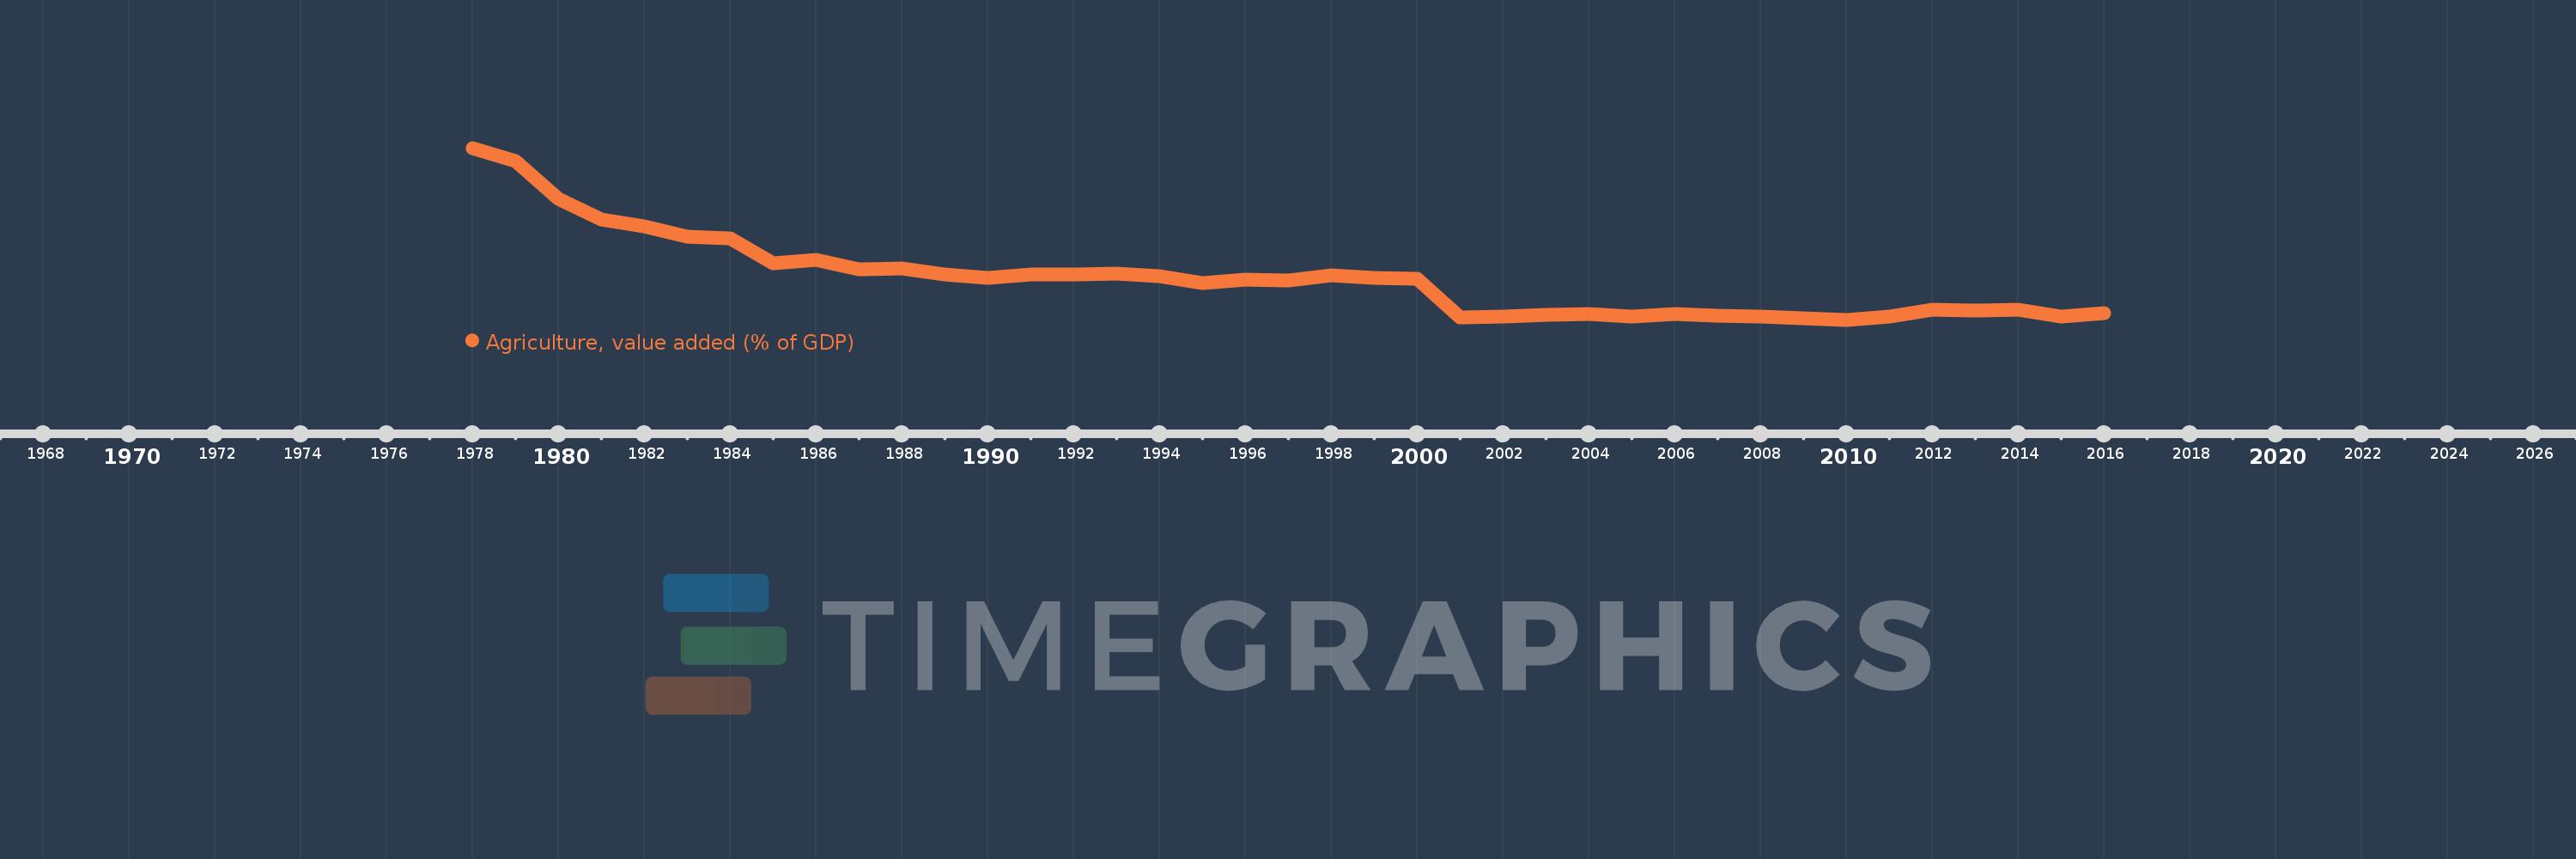
Agriculture, value added (% of GDP)
2016,2015,2014,2013,2012,2011,2010,2009,2008,2007,2006,2005,2004,2003,2002,2001,2000,1999,1998,1997,1996,1995,1994,1993,1992,1991,1990,1989,1988,1987,1986,1985,1984,1983,1982,1981,1980,1979,1978
This statistics in other country:
AfghanistanAlbaniaAlgeriaAndorraAngolaAntigua and BarbudaArab WorldArgentinaArmeniaArubaAustraliaAustriaAzerbaijanBahamas, TheBahrainBangladeshBarbadosBelarusBelgiumBelizeBeninBermudaBhutanBoliviaBosnia and HerzegovinaBotswanaBrazilBrunei DarussalamBulgariaBurkina FasoBurundiCabo VerdeCambodiaCameroonCanadaCaribbean small statesCayman IslandsCentral African RepublicCentral Europe and the BalticsChadChileChinaColombiaComorosCongo, Dem. Rep.Congo, Rep.Costa RicaCote d'IvoireCroatiaCubaCyprusCzech RepublicDenmarkDjiboutiDominicaDominican RepublicEarly-demographic dividendEast Asia & PacificEast Asia & Pacific (excluding high income)East Asia & Pacific (IDA & IBRD countries)EcuadorEgypt, Arab Rep.El SalvadorEquatorial GuineaEritreaEstoniaEthiopiaEuro areaEurope & Central AsiaEurope & Central Asia (excluding high income)Europe & Central Asia (IDA & IBRD countries)European UnionFijiFinlandFragile and conflict affected situationsFranceFrench PolynesiaGabonGambia, TheGeorgiaGermanyGhanaGreeceGrenadaGuatemalaGuineaGuinea-BissauGuyanaHeavily indebted poor countries (HIPC)High incomeHondurasHong Kong SAR, ChinaHungaryIBRD onlyIcelandIDA & IBRD totalIDA blendIDA onlyIDA totalIndiaIndonesiaIran, Islamic Rep.IrelandItalyJamaicaJapanJordanKazakhstanKenyaKiribatiKorea, Rep.KosovoKuwaitKyrgyz RepublicLao PDRLate-demographic dividendLatin America & Caribbean Latin America & Caribbean (excluding high income)Latin America & the Caribbean (IDA & IBRD countries)LatviaLeast developed countries: UN classificationLebanonLesothoLibyaLithuaniaLow & middle incomeLow incomeLower middle incomeLuxembourgMacao SAR, ChinaMacedonia, FYRMadagascarMalawiMalaysiaMaldivesMaliMaltaMarshall IslandsMauritaniaMauritiusMexicoMicronesia, Fed. Sts.Middle East & North AfricaMiddle East & North Africa (excluding high income)Middle East & North Africa (IDA & IBRD countries)Middle incomeMoldovaMongoliaMontenegroMoroccoMozambiqueMyanmarNamibiaNepalNetherlandsNew CaledoniaNew ZealandNicaraguaNigerNigeriaNorth AmericaNorwayOECD membersOmanOther small statesPacific island small statesPakistanPalauPanamaPapua New GuineaParaguayPeruPhilippinesPolandPortugalPost-demographic dividendPre-demographic dividendPuerto RicoQatarRomaniaRussian FederationRwandaSao Tome and PrincipeSaudi ArabiaSenegalSerbiaSeychellesSierra LeoneSingaporeSlovak RepublicSloveniaSmall statesSolomon IslandsSomaliaSouth AfricaSouth AsiaSouth Asia (IDA & IBRD)SpainSri LankaSt. Kitts and NevisSt. LuciaSt. Vincent and the GrenadinesSub-Saharan Africa Sub-Saharan Africa (excluding high income)Sub-Saharan Africa (IDA & IBRD countries)SudanSurinameSwazilandSwedenSwitzerlandSyrian Arab RepublicTajikistanTanzaniaThailandTimor-LesteTogoTongaTrinidad and TobagoTunisiaTurkeyTurkmenistanTuvaluUgandaUkraineUnited KingdomUnited StatesUpper middle incomeUruguayUzbekistanVanuatuVenezuela, RBVietnamWest Bank and GazaWorldYemen, Rep.ZambiaZimbabwe Timeline:
This timeline shows a graph from 1978 to 2016 of Antigua and Barbuda. No data until 1977. Number of actual observations by date: 39.
Source name:
World Development Indicators
Source organization:
World Bank national accounts data, and OECD National Accounts data files.
Categories, topics:
Agriculture & Rural Development, Economy & Growth, Climate Change
Last updated:
apr 23, 2017
Indicators value changes by year
Maximum:
10.963
jan 1, 1978
At the date of observation
Value
Absolute change
Change from previous value
jan 1, 1978
10.963
+10.963
0.0%
jan 1, 1979
10.273
-0.69
-6.3%
jan 1, 1980
8.232
-2.041
-19.87%
jan 1, 1981
7.117
-1.115
-13.55%
jan 1, 1982
6.773
-0.344
-4.83%
jan 1, 1983
6.212
-0.561
-8.29%
jan 1, 1984
6.122
-0.09
-1.45%
jan 1, 1985
4.784
-1.338
-21.86%
jan 1, 1986
4.939
+0.155
3.25%
jan 1, 1987
4.457
-0.482
-9.75%
jan 1, 1988
4.519
+0.062
1.38%
jan 1, 1989
4.183
-0.336
-7.43%
jan 1, 1990
3.99
-0.193
-4.62%
jan 1, 1991
4.178
+0.188
4.7%
jan 1, 1992
4.156
-0.021
-0.51%
jan 1, 1993
4.231
+0.074
1.79%
jan 1, 1994
4.095
-0.135
-3.2%
jan 1, 1995
3.726
-0.37
-9.02%
jan 1, 1996
3.88
+0.154
4.13%
jan 1, 1997
3.853
-0.026
-0.67%
jan 1, 1998
4.107
+0.253
6.58%
jan 1, 1999
3.967
-0.14
-3.41%
jan 1, 2000
3.945
-0.022
-0.55%
jan 1, 2001
1.886
-2.059
-52.2%
jan 1, 2002
1.893
+0.007
0.39%
jan 1, 2003
2.0
+0.107
5.64%
jan 1, 2004
2.033
+0.033
1.67%
jan 1, 2005
1.917
-0.116
-5.69%
jan 1, 2006
2.074
+0.157
8.16%
jan 1, 2007
1.951
-0.123
-5.92%
jan 1, 2008
1.937
-0.015
-0.75%
jan 1, 2009
1.836
-0.1
-5.17%
jan 1, 2010
1.745
-0.091
-4.96%
jan 1, 2011
1.927
+0.182
10.41%
jan 1, 2012
2.272
+0.345
17.9%
jan 1, 2013
2.217
-0.055
-2.43%
jan 1, 2014
2.284
+0.067
3.02%
jan 1, 2015
1.906
-0.378
-16.56%
jan 1, 2016
2.118
+0.212
11.13%
Ranking of countries by current statistics by years


Comments: