29
/
en
AIzaSyAYiBZKx7MnpbEhh9jyipgxe19OcubqV5w
April 1, 2024
219294
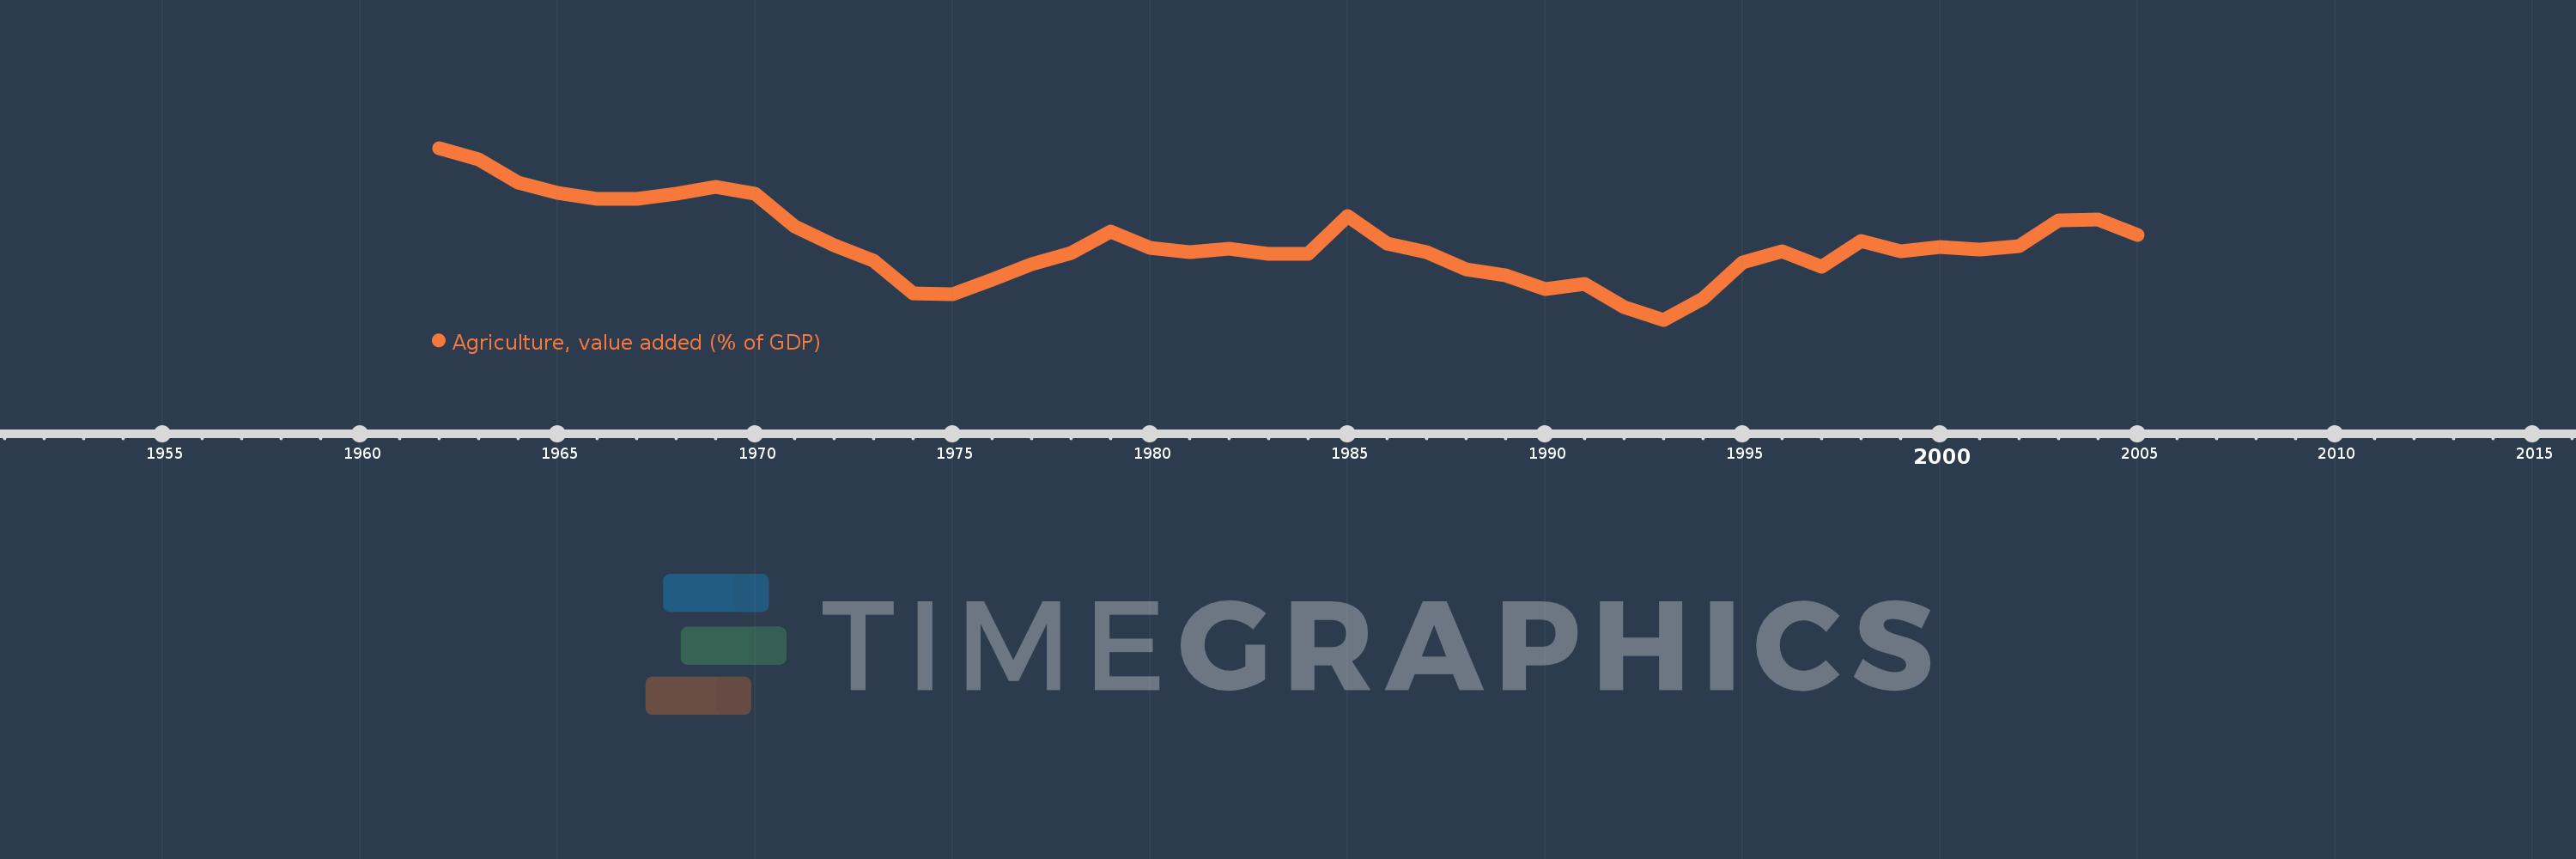
Papua New Guinea
PNG
true
2
1
Agriculture, value added (% of GDP)
2005,2004,2003,2002,2001,2000,1999,1998,1997,1996,1995,1994,1993,1992,1991,1990,1989,1988,1987,1986,1985,1984,1983,1982,1981,1980,1979,1978,1977,1976,1975,1974,1973,1972,1971,1970,1969,1968,1967,1966,1965,1964,1963,1962
This statistics in other country:
AfghanistanAlbaniaAlgeriaAndorraAngolaAntigua and BarbudaArab WorldArgentinaArmeniaArubaAustraliaAustriaAzerbaijanBahamas, TheBahrainBangladeshBarbadosBelarusBelgiumBelizeBeninBermudaBhutanBoliviaBosnia and HerzegovinaBotswanaBrazilBrunei DarussalamBulgariaBurkina FasoBurundiCabo VerdeCambodiaCameroonCanadaCaribbean small statesCayman IslandsCentral African RepublicCentral Europe and the BalticsChadChileChinaColombiaComorosCongo, Dem. Rep.Congo, Rep.Costa RicaCote d'IvoireCroatiaCubaCyprusCzech RepublicDenmarkDjiboutiDominicaDominican RepublicEarly-demographic dividendEast Asia & PacificEast Asia & Pacific (excluding high income)East Asia & Pacific (IDA & IBRD countries)EcuadorEgypt, Arab Rep.El SalvadorEquatorial GuineaEritreaEstoniaEthiopiaEuro areaEurope & Central AsiaEurope & Central Asia (excluding high income)Europe & Central Asia (IDA & IBRD countries)European UnionFijiFinlandFragile and conflict affected situationsFranceFrench PolynesiaGabonGambia, TheGeorgiaGermanyGhanaGreeceGrenadaGuatemalaGuineaGuinea-BissauGuyanaHeavily indebted poor countries (HIPC)High incomeHondurasHong Kong SAR, ChinaHungaryIBRD onlyIcelandIDA & IBRD totalIDA blendIDA onlyIDA totalIndiaIndonesiaIran, Islamic Rep.IrelandItalyJamaicaJapanJordanKazakhstanKenyaKiribatiKorea, Rep.KosovoKuwaitKyrgyz RepublicLao PDRLate-demographic dividendLatin America & Caribbean Latin America & Caribbean (excluding high income)Latin America & the Caribbean (IDA & IBRD countries)LatviaLeast developed countries: UN classificationLebanonLesothoLibyaLithuaniaLow & middle incomeLow incomeLower middle incomeLuxembourgMacao SAR, ChinaMacedonia, FYRMadagascarMalawiMalaysiaMaldivesMaliMaltaMarshall IslandsMauritaniaMauritiusMexicoMicronesia, Fed. Sts.Middle East & North AfricaMiddle East & North Africa (excluding high income)Middle East & North Africa (IDA & IBRD countries)Middle incomeMoldovaMongoliaMontenegroMoroccoMozambiqueMyanmarNamibiaNepalNetherlandsNew CaledoniaNew ZealandNicaraguaNigerNigeriaNorth AmericaNorwayOECD membersOmanOther small statesPacific island small statesPakistanPalauPanamaPapua New GuineaParaguayPeruPhilippinesPolandPortugalPost-demographic dividendPre-demographic dividendPuerto RicoQatarRomaniaRussian FederationRwandaSao Tome and PrincipeSaudi ArabiaSenegalSerbiaSeychellesSierra LeoneSingaporeSlovak RepublicSloveniaSmall statesSolomon IslandsSomaliaSouth AfricaSouth AsiaSouth Asia (IDA & IBRD)SpainSri LankaSt. Kitts and NevisSt. LuciaSt. Vincent and the GrenadinesSub-Saharan Africa Sub-Saharan Africa (excluding high income)Sub-Saharan Africa (IDA & IBRD countries)SudanSurinameSwazilandSwedenSwitzerlandSyrian Arab RepublicTajikistanTanzaniaThailandTimor-LesteTogoTongaTrinidad and TobagoTunisiaTurkeyTurkmenistanTuvaluUgandaUkraineUnited KingdomUnited StatesUpper middle incomeUruguayUzbekistanVanuatuVenezuela, RBVietnamWest Bank and GazaWorldYemen, Rep.ZambiaZimbabwe Timeline:
This timeline shows a graph from 1962 to 2005 of Papua New Guinea. No data until 1961. Number of actual observations by date: 44.
Source name:
World Development Indicators
Source organization:
World Bank national accounts data, and OECD National Accounts data files.
Categories, topics:
Agriculture & Rural Development, Economy & Growth, Climate Change
Last updated:
apr 23, 2017
Indicators value changes by year
Minimum:
25.664
jan 1, 1993
Maximum:
50.305
jan 1, 1962
At the date of observation
Value
Absolute change
Change from previous value
jan 1, 1962
50.305
+50.305
0.0%
jan 1, 1963
48.657
-1.648
-3.28%
jan 1, 1964
45.322
-3.335
-6.85%
jan 1, 1965
43.873
-1.449
-3.2%
jan 1, 1966
43.03
-0.843
-1.92%
jan 1, 1967
42.972
-0.058
-0.14%
jan 1, 1968
43.725
+0.753
1.75%
jan 1, 1969
44.728
+1.003
2.29%
jan 1, 1970
43.75
-0.978
-2.19%
jan 1, 1971
39.113
-4.637
-10.6%
jan 1, 1972
36.405
-2.708
-6.92%
jan 1, 1973
34.067
-2.338
-6.42%
jan 1, 1974
29.472
-4.595
-13.49%
jan 1, 1975
29.375
-0.097
-0.33%
jan 1, 1976
31.431
+2.056
7.0%
jan 1, 1977
33.599
+2.168
6.9%
jan 1, 1978
35.242
+1.644
4.89%
jan 1, 1979
38.328
+3.086
8.76%
jan 1, 1980
35.959
-2.369
-6.18%
jan 1, 1981
35.398
-0.561
-1.56%
jan 1, 1982
35.836
+0.437
1.24%
jan 1, 1983
35.125
-0.71
-1.98%
jan 1, 1984
35.17
+0.045
0.13%
jan 1, 1985
40.534
+5.364
15.25%
jan 1, 1986
36.632
-3.903
-9.63%
jan 1, 1987
35.342
-1.289
-3.52%
jan 1, 1988
32.906
-2.436
-6.89%
jan 1, 1989
32.007
-0.899
-2.73%
jan 1, 1990
30.123
-1.884
-5.89%
jan 1, 1991
30.859
+0.736
2.44%
jan 1, 1992
27.513
-3.346
-10.84%
jan 1, 1993
25.664
-1.849
-6.72%
jan 1, 1994
28.72
+3.057
11.91%
jan 1, 1995
33.866
+5.145
17.92%
jan 1, 1996
35.488
+1.623
4.79%
jan 1, 1997
33.308
-2.18
-6.14%
jan 1, 1998
36.966
+3.658
10.98%
jan 1, 1999
35.475
-1.491
-4.03%
jan 1, 2000
36.148
+0.673
1.9%
jan 1, 2001
35.772
-0.376
-1.04%
jan 1, 2002
36.267
+0.495
1.38%
jan 1, 2003
39.952
+3.684
10.16%
jan 1, 2004
40.057
+0.106
0.26%
jan 1, 2005
37.796
-2.261
-5.64%
Ranking of countries by current statistics by years


Comments: