29
/
en
AIzaSyAYiBZKx7MnpbEhh9jyipgxe19OcubqV5w
April 1, 2024
279499
Vanuatu
VUT
true
2
1
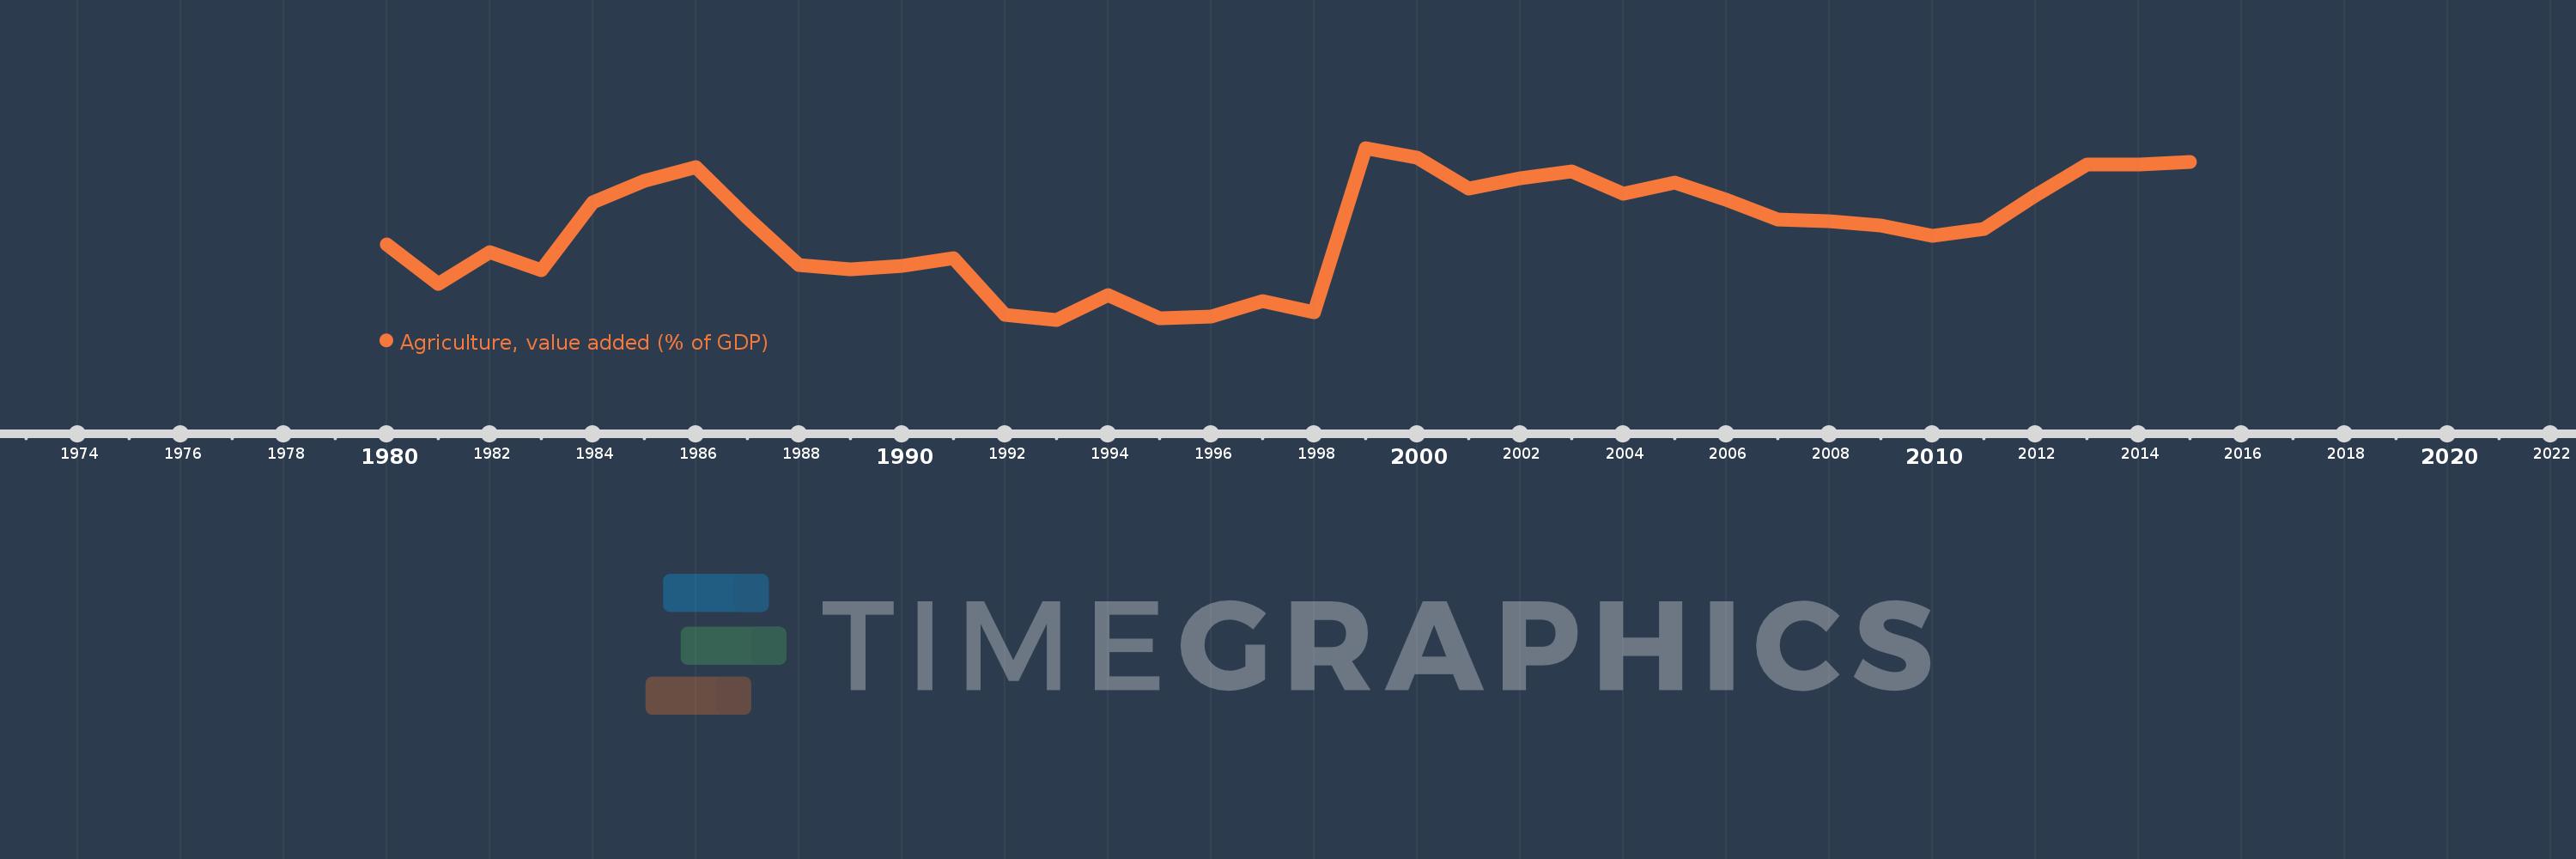
Agriculture, value added (% of GDP)
2015,2014,2013,2012,2011,2010,2009,2008,2007,2006,2005,2004,2003,2002,2001,2000,1999,1998,1997,1996,1995,1994,1993,1992,1991,1990,1989,1988,1987,1986,1985,1984,1983,1982,1981,1980
This statistics in other country:
AfghanistanAlbaniaAlgeriaAndorraAngolaAntigua and BarbudaArab WorldArgentinaArmeniaArubaAustraliaAustriaAzerbaijanBahamas, TheBahrainBangladeshBarbadosBelarusBelgiumBelizeBeninBermudaBhutanBoliviaBosnia and HerzegovinaBotswanaBrazilBrunei DarussalamBulgariaBurkina FasoBurundiCabo VerdeCambodiaCameroonCanadaCaribbean small statesCayman IslandsCentral African RepublicCentral Europe and the BalticsChadChileChinaColombiaComorosCongo, Dem. Rep.Congo, Rep.Costa RicaCote d'IvoireCroatiaCubaCyprusCzech RepublicDenmarkDjiboutiDominicaDominican RepublicEarly-demographic dividendEast Asia & PacificEast Asia & Pacific (excluding high income)East Asia & Pacific (IDA & IBRD countries)EcuadorEgypt, Arab Rep.El SalvadorEquatorial GuineaEritreaEstoniaEthiopiaEuro areaEurope & Central AsiaEurope & Central Asia (excluding high income)Europe & Central Asia (IDA & IBRD countries)European UnionFijiFinlandFragile and conflict affected situationsFranceFrench PolynesiaGabonGambia, TheGeorgiaGermanyGhanaGreeceGrenadaGuatemalaGuineaGuinea-BissauGuyanaHeavily indebted poor countries (HIPC)High incomeHondurasHong Kong SAR, ChinaHungaryIBRD onlyIcelandIDA & IBRD totalIDA blendIDA onlyIDA totalIndiaIndonesiaIran, Islamic Rep.IrelandItalyJamaicaJapanJordanKazakhstanKenyaKiribatiKorea, Rep.KosovoKuwaitKyrgyz RepublicLao PDRLate-demographic dividendLatin America & Caribbean Latin America & Caribbean (excluding high income)Latin America & the Caribbean (IDA & IBRD countries)LatviaLeast developed countries: UN classificationLebanonLesothoLibyaLithuaniaLow & middle incomeLow incomeLower middle incomeLuxembourgMacao SAR, ChinaMacedonia, FYRMadagascarMalawiMalaysiaMaldivesMaliMaltaMarshall IslandsMauritaniaMauritiusMexicoMicronesia, Fed. Sts.Middle East & North AfricaMiddle East & North Africa (excluding high income)Middle East & North Africa (IDA & IBRD countries)Middle incomeMoldovaMongoliaMontenegroMoroccoMozambiqueMyanmarNamibiaNepalNetherlandsNew CaledoniaNew ZealandNicaraguaNigerNigeriaNorth AmericaNorwayOECD membersOmanOther small statesPacific island small statesPakistanPalauPanamaPapua New GuineaParaguayPeruPhilippinesPolandPortugalPost-demographic dividendPre-demographic dividendPuerto RicoQatarRomaniaRussian FederationRwandaSao Tome and PrincipeSaudi ArabiaSenegalSerbiaSeychellesSierra LeoneSingaporeSlovak RepublicSloveniaSmall statesSolomon IslandsSomaliaSouth AfricaSouth AsiaSouth Asia (IDA & IBRD)SpainSri LankaSt. Kitts and NevisSt. LuciaSt. Vincent and the GrenadinesSub-Saharan Africa Sub-Saharan Africa (excluding high income)Sub-Saharan Africa (IDA & IBRD countries)SudanSurinameSwazilandSwedenSwitzerlandSyrian Arab RepublicTajikistanTanzaniaThailandTimor-LesteTogoTongaTrinidad and TobagoTunisiaTurkeyTurkmenistanTuvaluUgandaUkraineUnited KingdomUnited StatesUpper middle incomeUruguayUzbekistanVanuatuVenezuela, RBVietnamWest Bank and GazaWorldYemen, Rep.ZambiaZimbabwe Timeline:
This timeline shows a graph from 1980 to 2015 of Vanuatu. No data until 1979. Number of actual observations by date: 36.
Source name:
World Development Indicators
Source organization:
World Bank national accounts data, and OECD National Accounts data files.
Categories, topics:
Agriculture & Rural Development, Economy & Growth, Climate Change
Last updated:
apr 23, 2017
Indicators value changes by year
Maximum:
29.254
jan 1, 1999
At the date of observation
Value
Absolute change
Change from previous value
jan 1, 1980
21.951
+21.951
0.0%
jan 1, 1981
18.898
-3.053
-13.91%
jan 1, 1982
21.35
+2.452
12.98%
jan 1, 1983
19.972
-1.378
-6.46%
jan 1, 1984
25.103
+5.131
25.69%
jan 1, 1985
26.749
+1.646
6.56%
jan 1, 1986
27.821
+1.072
4.01%
jan 1, 1987
23.944
-3.877
-13.94%
jan 1, 1988
20.366
-3.578
-14.94%
jan 1, 1989
20.023
-0.343
-1.68%
jan 1, 1990
20.285
+0.262
1.31%
jan 1, 1991
20.877
+0.592
2.92%
jan 1, 1992
16.56
-4.317
-20.68%
jan 1, 1993
16.2
-0.36
-2.18%
jan 1, 1994
18.074
+1.874
11.57%
jan 1, 1995
16.283
-1.791
-9.91%
jan 1, 1996
16.444
+0.16
0.98%
jan 1, 1997
17.601
+1.157
7.04%
jan 1, 1998
16.745
-0.855
-4.86%
jan 1, 1999
29.254
+12.508
74.7%
jan 1, 2000
28.536
-0.718
-2.45%
jan 1, 2001
26.181
-2.354
-8.25%
jan 1, 2002
26.926
+0.744
2.84%
jan 1, 2003
27.469
+0.543
2.02%
jan 1, 2004
25.743
-1.726
-6.28%
jan 1, 2005
26.652
+0.909
3.53%
jan 1, 2006
25.311
-1.342
-5.03%
jan 1, 2007
23.795
-1.516
-5.99%
jan 1, 2008
23.692
-0.102
-0.43%
jan 1, 2009
23.378
-0.314
-1.33%
jan 1, 2010
22.605
-0.773
-3.31%
jan 1, 2011
23.087
+0.482
2.13%
jan 1, 2012
25.633
+2.546
11.03%
jan 1, 2013
27.965
+2.332
9.1%
jan 1, 2014
27.977
+0.012
0.04%
jan 1, 2015
28.202
+0.224
0.8%
Ranking of countries by current statistics by years


Comments: