29
/
en
AIzaSyAYiBZKx7MnpbEhh9jyipgxe19OcubqV5w
April 1, 2024
211336
Niger
NER
true
2
1
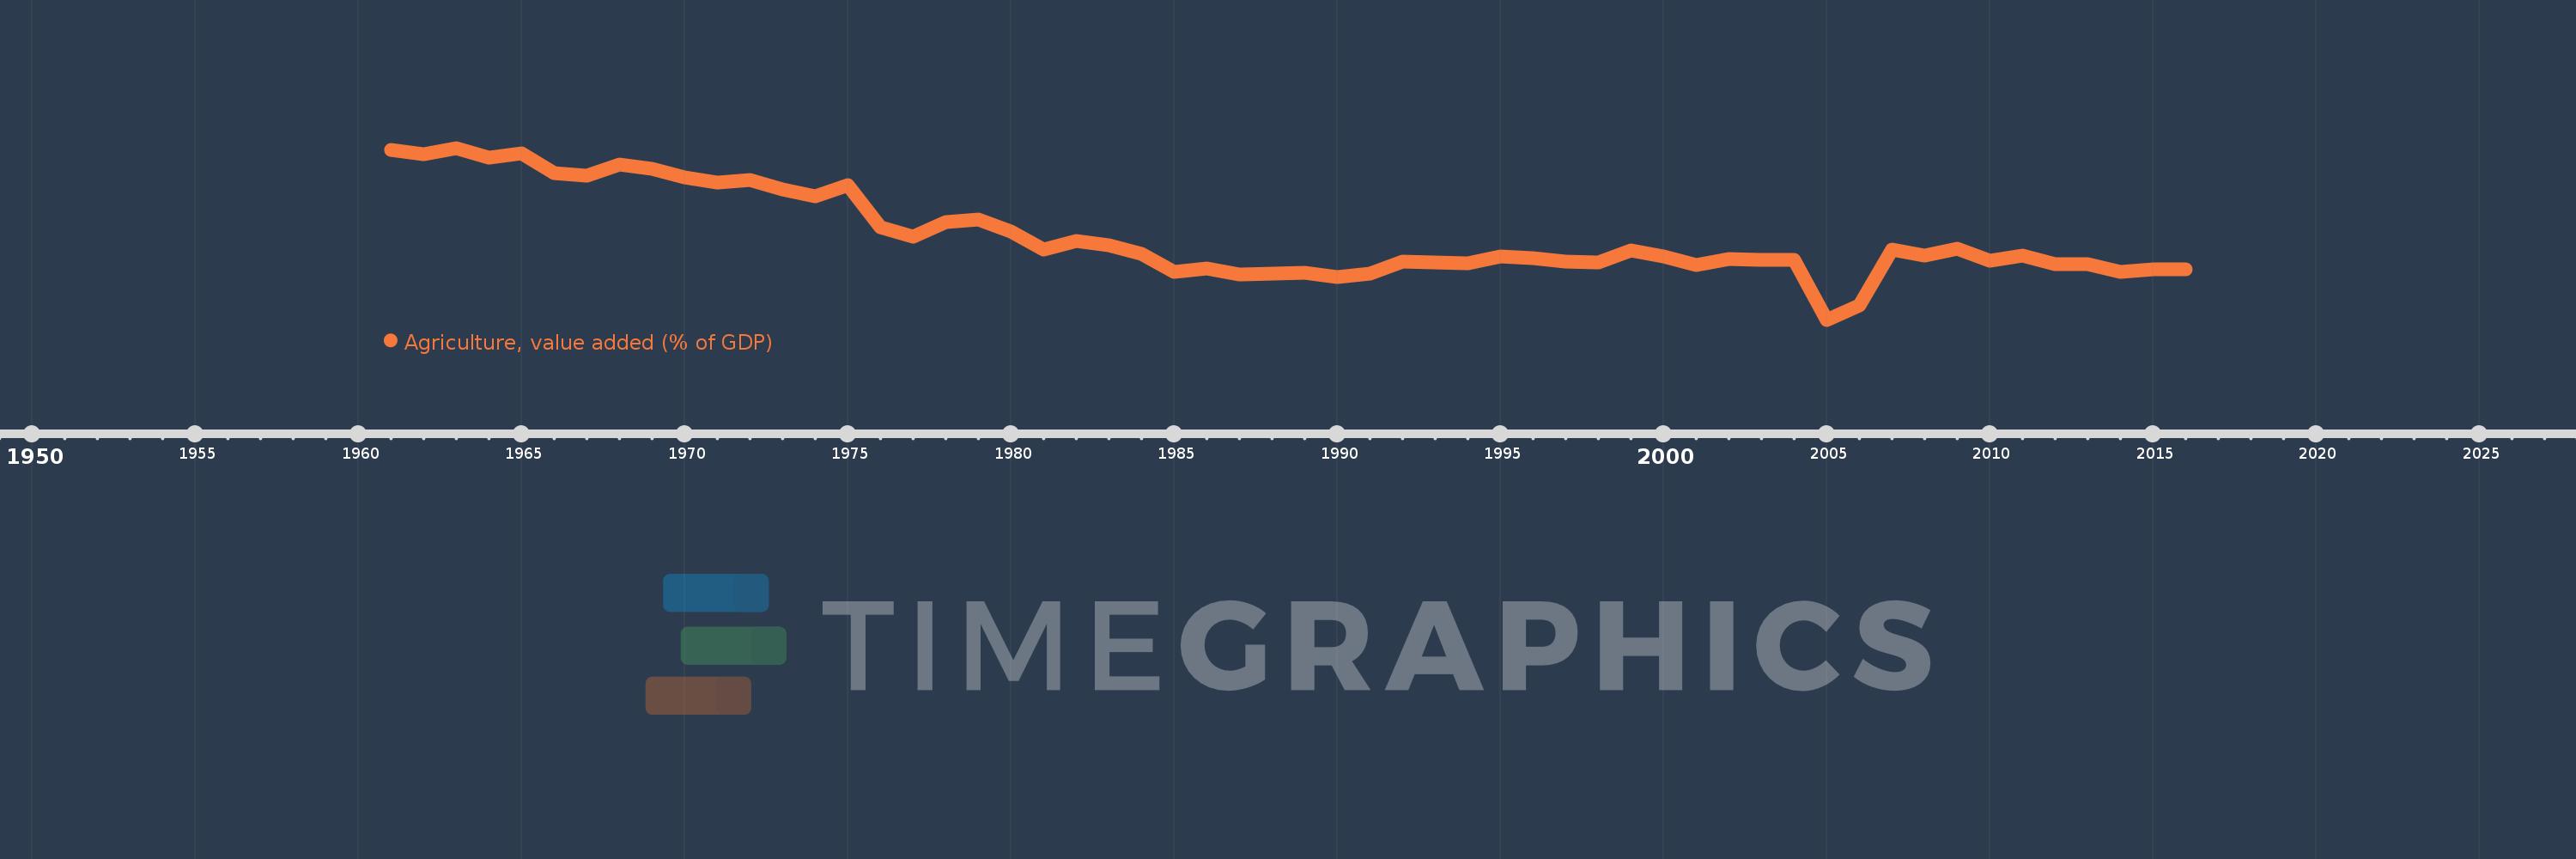
Agriculture, value added (% of GDP)
2016,2015,2014,2013,2012,2011,2010,2009,2008,2007,2006,2005,2004,2003,2002,2001,2000,1999,1998,1997,1996,1995,1994,1993,1992,1991,1990,1989,1988,1987,1986,1985,1984,1983,1982,1981,1980,1979,1978,1977,1976,1975,1974,1973,1972,1971,1970,1969,1968,1967,1966,1965,1964,1963,1962,1961
This statistics in other country:
AfghanistanAlbaniaAlgeriaAndorraAngolaAntigua and BarbudaArab WorldArgentinaArmeniaArubaAustraliaAustriaAzerbaijanBahamas, TheBahrainBangladeshBarbadosBelarusBelgiumBelizeBeninBermudaBhutanBoliviaBosnia and HerzegovinaBotswanaBrazilBrunei DarussalamBulgariaBurkina FasoBurundiCabo VerdeCambodiaCameroonCanadaCaribbean small statesCayman IslandsCentral African RepublicCentral Europe and the BalticsChadChileChinaColombiaComorosCongo, Dem. Rep.Congo, Rep.Costa RicaCote d'IvoireCroatiaCubaCyprusCzech RepublicDenmarkDjiboutiDominicaDominican RepublicEarly-demographic dividendEast Asia & PacificEast Asia & Pacific (excluding high income)East Asia & Pacific (IDA & IBRD countries)EcuadorEgypt, Arab Rep.El SalvadorEquatorial GuineaEritreaEstoniaEthiopiaEuro areaEurope & Central AsiaEurope & Central Asia (excluding high income)Europe & Central Asia (IDA & IBRD countries)European UnionFijiFinlandFragile and conflict affected situationsFranceFrench PolynesiaGabonGambia, TheGeorgiaGermanyGhanaGreeceGrenadaGuatemalaGuineaGuinea-BissauGuyanaHeavily indebted poor countries (HIPC)High incomeHondurasHong Kong SAR, ChinaHungaryIBRD onlyIcelandIDA & IBRD totalIDA blendIDA onlyIDA totalIndiaIndonesiaIran, Islamic Rep.IrelandItalyJamaicaJapanJordanKazakhstanKenyaKiribatiKorea, Rep.KosovoKuwaitKyrgyz RepublicLao PDRLate-demographic dividendLatin America & Caribbean Latin America & Caribbean (excluding high income)Latin America & the Caribbean (IDA & IBRD countries)LatviaLeast developed countries: UN classificationLebanonLesothoLibyaLithuaniaLow & middle incomeLow incomeLower middle incomeLuxembourgMacao SAR, ChinaMacedonia, FYRMadagascarMalawiMalaysiaMaldivesMaliMaltaMarshall IslandsMauritaniaMauritiusMexicoMicronesia, Fed. Sts.Middle East & North AfricaMiddle East & North Africa (excluding high income)Middle East & North Africa (IDA & IBRD countries)Middle incomeMoldovaMongoliaMontenegroMoroccoMozambiqueMyanmarNamibiaNepalNetherlandsNew CaledoniaNew ZealandNicaraguaNigerNigeriaNorth AmericaNorwayOECD membersOmanOther small statesPacific island small statesPakistanPalauPanamaPapua New GuineaParaguayPeruPhilippinesPolandPortugalPost-demographic dividendPre-demographic dividendPuerto RicoQatarRomaniaRussian FederationRwandaSao Tome and PrincipeSaudi ArabiaSenegalSerbiaSeychellesSierra LeoneSingaporeSlovak RepublicSloveniaSmall statesSolomon IslandsSomaliaSouth AfricaSouth AsiaSouth Asia (IDA & IBRD)SpainSri LankaSt. Kitts and NevisSt. LuciaSt. Vincent and the GrenadinesSub-Saharan Africa Sub-Saharan Africa (excluding high income)Sub-Saharan Africa (IDA & IBRD countries)SudanSurinameSwazilandSwedenSwitzerlandSyrian Arab RepublicTajikistanTanzaniaThailandTimor-LesteTogoTongaTrinidad and TobagoTunisiaTurkeyTurkmenistanTuvaluUgandaUkraineUnited KingdomUnited StatesUpper middle incomeUruguayUzbekistanVanuatuVenezuela, RBVietnamWest Bank and GazaWorldYemen, Rep.ZambiaZimbabwe Timeline:
This timeline shows a graph from 1961 to 2016 of Niger. No data until 1960. Number of actual observations by date: 56.
Source name:
World Development Indicators
Source organization:
World Bank national accounts data, and OECD National Accounts data files.
Categories, topics:
Agriculture & Rural Development, Economy & Growth, Climate Change
Last updated:
apr 23, 2017
Indicators value changes by year
Minimum:
20.116
jan 1, 2005
Maximum:
75.998
jan 1, 1963
At the date of observation
Value
Absolute change
Change from previous value
jan 1, 1961
75.324
+75.324
0.0%
jan 1, 1962
73.887
-1.437
-1.91%
jan 1, 1963
75.998
+2.11
2.86%
jan 1, 1964
72.948
-3.05
-4.01%
jan 1, 1965
74.324
+1.376
1.89%
jan 1, 1966
67.704
-6.62
-8.91%
jan 1, 1967
66.875
-0.829
-1.22%
jan 1, 1968
70.706
+3.832
5.73%
jan 1, 1969
69.168
-1.538
-2.18%
jan 1, 1970
66.419
-2.749
-3.97%
jan 1, 1971
64.875
-1.544
-2.33%
jan 1, 1972
65.461
+0.586
0.9%
jan 1, 1973
62.46
-3.001
-4.58%
jan 1, 1974
60.271
-2.189
-3.5%
jan 1, 1975
63.795
+3.524
5.85%
jan 1, 1976
50.311
-13.484
-21.14%
jan 1, 1977
47.028
-3.284
-6.53%
jan 1, 1978
51.787
+4.759
10.12%
jan 1, 1979
52.68
+0.893
1.72%
jan 1, 1980
48.685
-3.996
-7.59%
jan 1, 1981
43.057
-5.628
-11.56%
jan 1, 1982
45.652
+2.595
6.03%
jan 1, 1983
44.299
-1.353
-2.96%
jan 1, 1984
41.581
-2.718
-6.14%
jan 1, 1985
35.771
-5.809
-13.97%
jan 1, 1986
36.743
+0.972
2.72%
jan 1, 1987
34.729
-2.014
-5.48%
jan 1, 1988
35.211
+0.482
1.39%
jan 1, 1989
35.35
+0.14
0.4%
jan 1, 1990
34.072
-1.279
-3.62%
jan 1, 1991
35.253
+1.182
3.47%
jan 1, 1992
39.163
+3.91
11.09%
jan 1, 1993
38.754
-0.41
-1.05%
jan 1, 1994
38.474
-0.28
-0.72%
jan 1, 1995
40.8
+2.326
6.05%
jan 1, 1996
40.19
-0.61
-1.5%
jan 1, 1997
38.934
-1.256
-3.12%
jan 1, 1998
38.869
-0.065
-0.17%
jan 1, 1999
42.622
+3.754
9.66%
jan 1, 2000
40.729
-1.893
-4.44%
jan 1, 2001
37.84
-2.889
-7.09%
jan 1, 2002
40.007
+2.167
5.73%
jan 1, 2003
39.569
-0.438
-1.09%
jan 1, 2004
39.647
+0.078
0.2%
jan 1, 2005
20.116
-19.531
-49.26%
jan 1, 2006
24.728
+4.612
22.93%
jan 1, 2007
42.881
+18.152
73.41%
jan 1, 2008
40.968
-1.912
-4.46%
jan 1, 2009
43.205
+2.237
5.46%
jan 1, 2010
39.214
-3.991
-9.24%
jan 1, 2011
40.898
+1.684
4.29%
jan 1, 2012
38.251
-2.648
-6.47%
jan 1, 2013
38.082
-0.169
-0.44%
jan 1, 2014
35.801
-2.281
-5.99%
jan 1, 2015
36.53
+0.729
2.04%
jan 1, 2016
36.419
-0.111
-0.31%
Ranking of countries by current statistics by years


Comments: