29
/
en
AIzaSyAYiBZKx7MnpbEhh9jyipgxe19OcubqV5w
April 1, 2024
146541
Guinea-Bissau
GNB
true
2
1
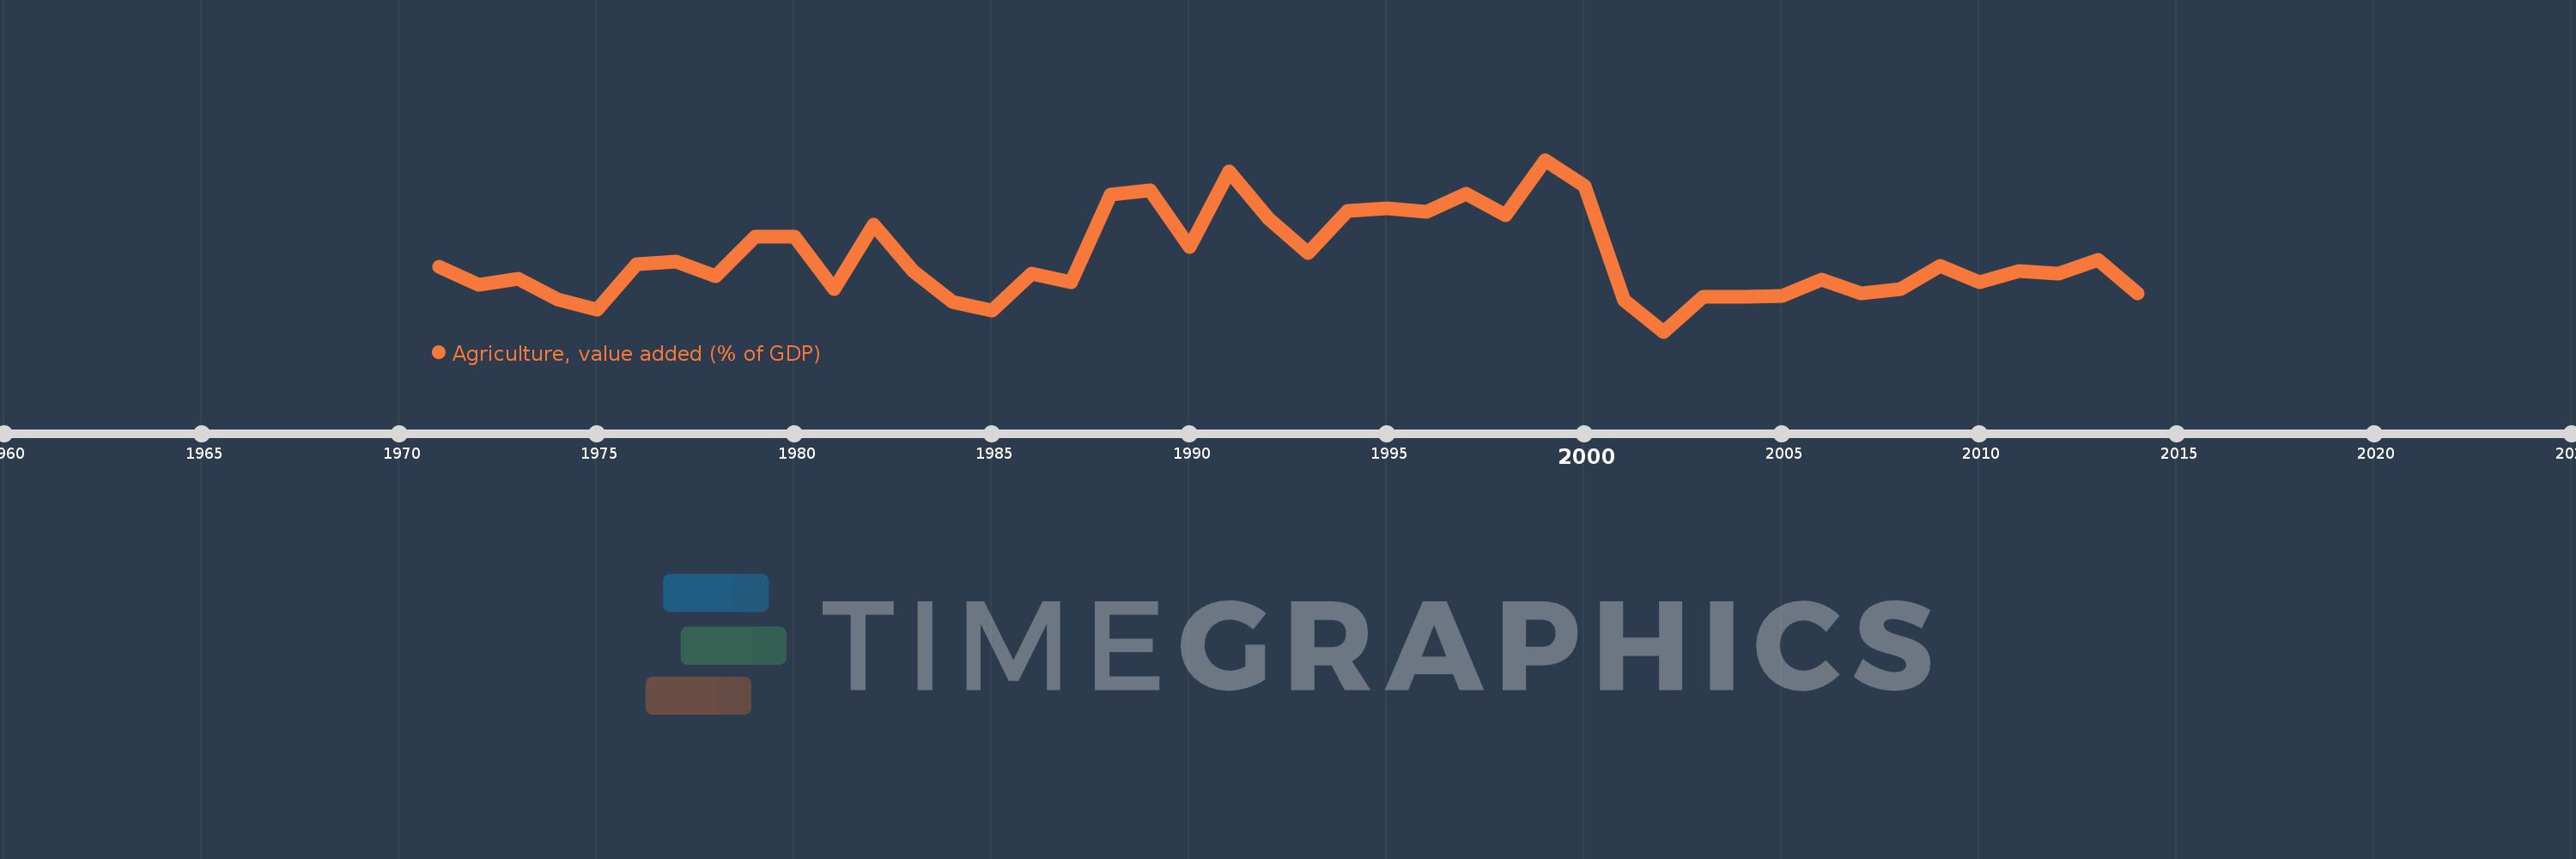
Agriculture, value added (% of GDP)
2014,2013,2012,2011,2010,2009,2008,2007,2006,2005,2004,2003,2002,2001,2000,1999,1998,1997,1996,1995,1994,1993,1992,1991,1990,1989,1988,1987,1986,1985,1984,1983,1982,1981,1980,1979,1978,1977,1976,1975,1974,1973,1972,1971
This statistics in other country:
AfghanistanAlbaniaAlgeriaAndorraAngolaAntigua and BarbudaArab WorldArgentinaArmeniaArubaAustraliaAustriaAzerbaijanBahamas, TheBahrainBangladeshBarbadosBelarusBelgiumBelizeBeninBermudaBhutanBoliviaBosnia and HerzegovinaBotswanaBrazilBrunei DarussalamBulgariaBurkina FasoBurundiCabo VerdeCambodiaCameroonCanadaCaribbean small statesCayman IslandsCentral African RepublicCentral Europe and the BalticsChadChileChinaColombiaComorosCongo, Dem. Rep.Congo, Rep.Costa RicaCote d'IvoireCroatiaCubaCyprusCzech RepublicDenmarkDjiboutiDominicaDominican RepublicEarly-demographic dividendEast Asia & PacificEast Asia & Pacific (excluding high income)East Asia & Pacific (IDA & IBRD countries)EcuadorEgypt, Arab Rep.El SalvadorEquatorial GuineaEritreaEstoniaEthiopiaEuro areaEurope & Central AsiaEurope & Central Asia (excluding high income)Europe & Central Asia (IDA & IBRD countries)European UnionFijiFinlandFragile and conflict affected situationsFranceFrench PolynesiaGabonGambia, TheGeorgiaGermanyGhanaGreeceGrenadaGuatemalaGuineaGuinea-BissauGuyanaHeavily indebted poor countries (HIPC)High incomeHondurasHong Kong SAR, ChinaHungaryIBRD onlyIcelandIDA & IBRD totalIDA blendIDA onlyIDA totalIndiaIndonesiaIran, Islamic Rep.IrelandItalyJamaicaJapanJordanKazakhstanKenyaKiribatiKorea, Rep.KosovoKuwaitKyrgyz RepublicLao PDRLate-demographic dividendLatin America & Caribbean Latin America & Caribbean (excluding high income)Latin America & the Caribbean (IDA & IBRD countries)LatviaLeast developed countries: UN classificationLebanonLesothoLibyaLithuaniaLow & middle incomeLow incomeLower middle incomeLuxembourgMacao SAR, ChinaMacedonia, FYRMadagascarMalawiMalaysiaMaldivesMaliMaltaMarshall IslandsMauritaniaMauritiusMexicoMicronesia, Fed. Sts.Middle East & North AfricaMiddle East & North Africa (excluding high income)Middle East & North Africa (IDA & IBRD countries)Middle incomeMoldovaMongoliaMontenegroMoroccoMozambiqueMyanmarNamibiaNepalNetherlandsNew CaledoniaNew ZealandNicaraguaNigerNigeriaNorth AmericaNorwayOECD membersOmanOther small statesPacific island small statesPakistanPalauPanamaPapua New GuineaParaguayPeruPhilippinesPolandPortugalPost-demographic dividendPre-demographic dividendPuerto RicoQatarRomaniaRussian FederationRwandaSao Tome and PrincipeSaudi ArabiaSenegalSerbiaSeychellesSierra LeoneSingaporeSlovak RepublicSloveniaSmall statesSolomon IslandsSomaliaSouth AfricaSouth AsiaSouth Asia (IDA & IBRD)SpainSri LankaSt. Kitts and NevisSt. LuciaSt. Vincent and the GrenadinesSub-Saharan Africa Sub-Saharan Africa (excluding high income)Sub-Saharan Africa (IDA & IBRD countries)SudanSurinameSwazilandSwedenSwitzerlandSyrian Arab RepublicTajikistanTanzaniaThailandTimor-LesteTogoTongaTrinidad and TobagoTunisiaTurkeyTurkmenistanTuvaluUgandaUkraineUnited KingdomUnited StatesUpper middle incomeUruguayUzbekistanVanuatuVenezuela, RBVietnamWest Bank and GazaWorldYemen, Rep.ZambiaZimbabwe Timeline:
This timeline shows a graph from 1971 to 2014 of Guinea-Bissau. No data until 1970. Number of actual observations by date: 44.
Source name:
World Development Indicators
Source organization:
World Bank national accounts data, and OECD National Accounts data files.
Categories, topics:
Agriculture & Rural Development, Economy & Growth, Climate Change
Last updated:
apr 23, 2017
Indicators value changes by year
Minimum:
38.343
jan 1, 2002
Maximum:
62.383
jan 1, 1999
At the date of observation
Value
Absolute change
Change from previous value
jan 1, 1971
47.456
+47.456
0.0%
jan 1, 1972
44.851
-2.605
-5.49%
jan 1, 1973
45.781
+0.931
2.07%
jan 1, 1974
42.883
-2.899
-6.33%
jan 1, 1975
41.38
-1.503
-3.5%
jan 1, 1976
47.772
+6.392
15.45%
jan 1, 1977
48.09
+0.318
0.67%
jan 1, 1978
46.154
-1.935
-4.02%
jan 1, 1979
51.613
+5.459
11.83%
jan 1, 1980
51.589
-0.024
-0.05%
jan 1, 1981
44.287
-7.302
-14.15%
jan 1, 1982
53.278
+8.99
20.3%
jan 1, 1983
46.765
-6.512
-12.22%
jan 1, 1984
42.45
-4.315
-9.23%
jan 1, 1985
41.317
-1.133
-2.67%
jan 1, 1986
46.487
+5.17
12.51%
jan 1, 1987
45.261
-1.226
-2.64%
jan 1, 1988
57.568
+12.307
27.19%
jan 1, 1989
58.134
+0.566
0.98%
jan 1, 1990
50.171
-7.963
-13.7%
jan 1, 1991
60.803
+10.632
21.19%
jan 1, 1992
54.112
-6.691
-11.0%
jan 1, 1993
49.367
-4.746
-8.77%
jan 1, 1994
55.225
+5.859
11.87%
jan 1, 1995
55.594
+0.368
0.67%
jan 1, 1996
55.055
-0.539
-0.97%
jan 1, 1997
57.601
+2.545
4.62%
jan 1, 1998
54.605
-2.996
-5.2%
jan 1, 1999
62.383
+7.778
14.24%
jan 1, 2000
58.693
-3.689
-5.91%
jan 1, 2001
42.738
-15.956
-27.18%
jan 1, 2002
38.343
-4.395
-10.28%
jan 1, 2003
43.213
+4.87
12.7%
jan 1, 2004
43.166
-0.046
-0.11%
jan 1, 2005
43.305
+0.139
0.32%
jan 1, 2006
45.623
+2.318
5.35%
jan 1, 2007
43.652
-1.972
-4.32%
jan 1, 2008
44.326
+0.674
1.54%
jan 1, 2009
47.548
+3.222
7.27%
jan 1, 2010
45.297
-2.251
-4.73%
jan 1, 2011
46.78
+1.483
3.27%
jan 1, 2012
46.423
-0.358
-0.76%
jan 1, 2013
48.33
+1.908
4.11%
jan 1, 2014
43.679
-4.652
-9.62%
Ranking of countries by current statistics by years


Comments: