29
/
en
AIzaSyAYiBZKx7MnpbEhh9jyipgxe19OcubqV5w
April 1, 2024
55318
Pre-demographic dividend
PRE
false
2
1
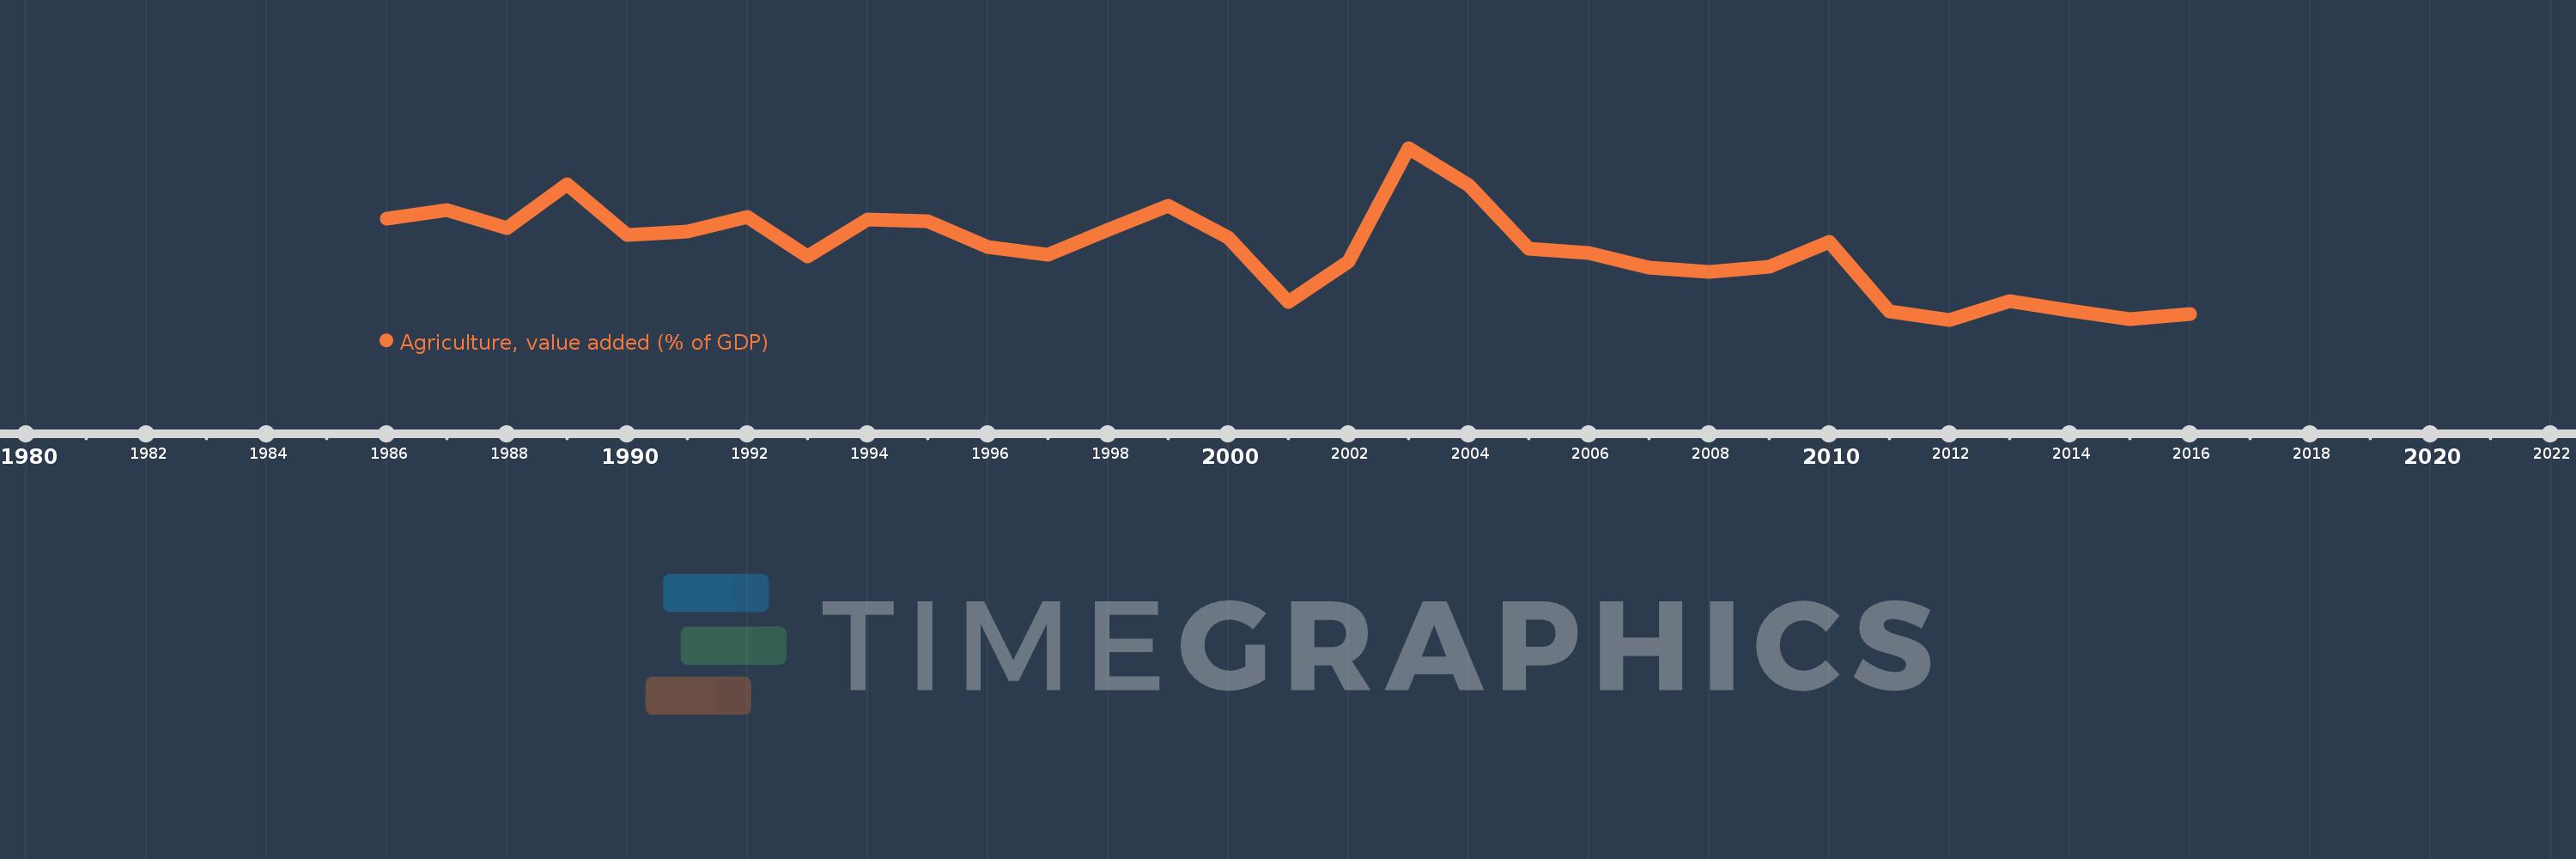
Agriculture, value added (% of GDP)
2016,2015,2014,2013,2012,2011,2010,2009,2008,2007,2006,2005,2004,2003,2002,2001,2000,1999,1998,1997,1996,1995,1994,1993,1992,1991,1990,1989,1988,1987,1986
This statistics in other country:
AfghanistanAlbaniaAlgeriaAndorraAngolaAntigua and BarbudaArab WorldArgentinaArmeniaArubaAustraliaAustriaAzerbaijanBahamas, TheBahrainBangladeshBarbadosBelarusBelgiumBelizeBeninBermudaBhutanBoliviaBosnia and HerzegovinaBotswanaBrazilBrunei DarussalamBulgariaBurkina FasoBurundiCabo VerdeCambodiaCameroonCanadaCaribbean small statesCayman IslandsCentral African RepublicCentral Europe and the BalticsChadChileChinaColombiaComorosCongo, Dem. Rep.Congo, Rep.Costa RicaCote d'IvoireCroatiaCubaCyprusCzech RepublicDenmarkDjiboutiDominicaDominican RepublicEarly-demographic dividendEast Asia & PacificEast Asia & Pacific (excluding high income)East Asia & Pacific (IDA & IBRD countries)EcuadorEgypt, Arab Rep.El SalvadorEquatorial GuineaEritreaEstoniaEthiopiaEuro areaEurope & Central AsiaEurope & Central Asia (excluding high income)Europe & Central Asia (IDA & IBRD countries)European UnionFijiFinlandFragile and conflict affected situationsFranceFrench PolynesiaGabonGambia, TheGeorgiaGermanyGhanaGreeceGrenadaGuatemalaGuineaGuinea-BissauGuyanaHeavily indebted poor countries (HIPC)High incomeHondurasHong Kong SAR, ChinaHungaryIBRD onlyIcelandIDA & IBRD totalIDA blendIDA onlyIDA totalIndiaIndonesiaIran, Islamic Rep.IrelandItalyJamaicaJapanJordanKazakhstanKenyaKiribatiKorea, Rep.KosovoKuwaitKyrgyz RepublicLao PDRLate-demographic dividendLatin America & Caribbean Latin America & Caribbean (excluding high income)Latin America & the Caribbean (IDA & IBRD countries)LatviaLeast developed countries: UN classificationLebanonLesothoLibyaLithuaniaLow & middle incomeLow incomeLower middle incomeLuxembourgMacao SAR, ChinaMacedonia, FYRMadagascarMalawiMalaysiaMaldivesMaliMaltaMarshall IslandsMauritaniaMauritiusMexicoMicronesia, Fed. Sts.Middle East & North AfricaMiddle East & North Africa (excluding high income)Middle East & North Africa (IDA & IBRD countries)Middle incomeMoldovaMongoliaMontenegroMoroccoMozambiqueMyanmarNamibiaNepalNetherlandsNew CaledoniaNew ZealandNicaraguaNigerNigeriaNorth AmericaNorwayOECD membersOmanOther small statesPacific island small statesPakistanPalauPanamaPapua New GuineaParaguayPeruPhilippinesPolandPortugalPost-demographic dividendPre-demographic dividendPuerto RicoQatarRomaniaRussian FederationRwandaSao Tome and PrincipeSaudi ArabiaSenegalSerbiaSeychellesSierra LeoneSingaporeSlovak RepublicSloveniaSmall statesSolomon IslandsSomaliaSouth AfricaSouth AsiaSouth Asia (IDA & IBRD)SpainSri LankaSt. Kitts and NevisSt. LuciaSt. Vincent and the GrenadinesSub-Saharan Africa Sub-Saharan Africa (excluding high income)Sub-Saharan Africa (IDA & IBRD countries)SudanSurinameSwazilandSwedenSwitzerlandSyrian Arab RepublicTajikistanTanzaniaThailandTimor-LesteTogoTongaTrinidad and TobagoTunisiaTurkeyTurkmenistanTuvaluUgandaUkraineUnited KingdomUnited StatesUpper middle incomeUruguayUzbekistanVanuatuVenezuela, RBVietnamWest Bank and GazaWorldYemen, Rep.ZambiaZimbabwe Timeline:
This timeline shows a graph from 1986 to 2016 of Pre-demographic dividend. No data until 1985. Number of actual observations by date: 31.
Source name:
World Development Indicators
Source organization:
World Bank national accounts data, and OECD National Accounts data files.
Categories, topics:
Agriculture & Rural Development, Economy & Growth, Climate Change
Last updated:
apr 23, 2017
Indicators value changes by year
Minimum:
24.785
jan 1, 2012
Maximum:
37.638
jan 1, 2003
At the date of observation
Value
Absolute change
Change from previous value
jan 1, 1986
32.331
+32.331
0.0%
jan 1, 1987
33.018
+0.687
2.12%
jan 1, 1988
31.67
-1.348
-4.08%
jan 1, 1989
34.898
+3.228
10.19%
jan 1, 1990
31.111
-3.787
-10.85%
jan 1, 1991
31.364
+0.253
0.81%
jan 1, 1992
32.476
+1.112
3.54%
jan 1, 1993
29.529
-2.947
-9.07%
jan 1, 1994
32.285
+2.756
9.33%
jan 1, 1995
32.155
-0.129
-0.4%
jan 1, 1996
30.241
-1.914
-5.95%
jan 1, 1997
29.665
-0.576
-1.91%
jan 1, 1998
31.535
+1.87
6.3%
jan 1, 1999
33.335
+1.799
5.71%
jan 1, 2000
30.935
-2.4
-7.2%
jan 1, 2001
26.124
-4.81
-15.55%
jan 1, 2002
29.156
+3.032
11.61%
jan 1, 2003
37.638
+8.482
29.09%
jan 1, 2004
34.853
-2.785
-7.4%
jan 1, 2005
30.096
-4.757
-13.65%
jan 1, 2006
29.754
-0.342
-1.14%
jan 1, 2007
28.668
-1.086
-3.65%
jan 1, 2008
28.388
-0.279
-0.97%
jan 1, 2009
28.745
+0.357
1.26%
jan 1, 2010
30.631
+1.886
6.56%
jan 1, 2011
25.425
-5.207
-17.0%
jan 1, 2012
24.785
-0.639
-2.51%
jan 1, 2013
26.155
+1.37
5.53%
jan 1, 2014
25.488
-0.667
-2.55%
jan 1, 2015
24.821
-0.666
-2.61%
jan 1, 2016
25.194
+0.373
1.5%
Ranking of countries by current statistics by years


Comments: