29
/
en
AIzaSyAYiBZKx7MnpbEhh9jyipgxe19OcubqV5w
April 1, 2024
61342
Upper middle income
UMC
false
2
1
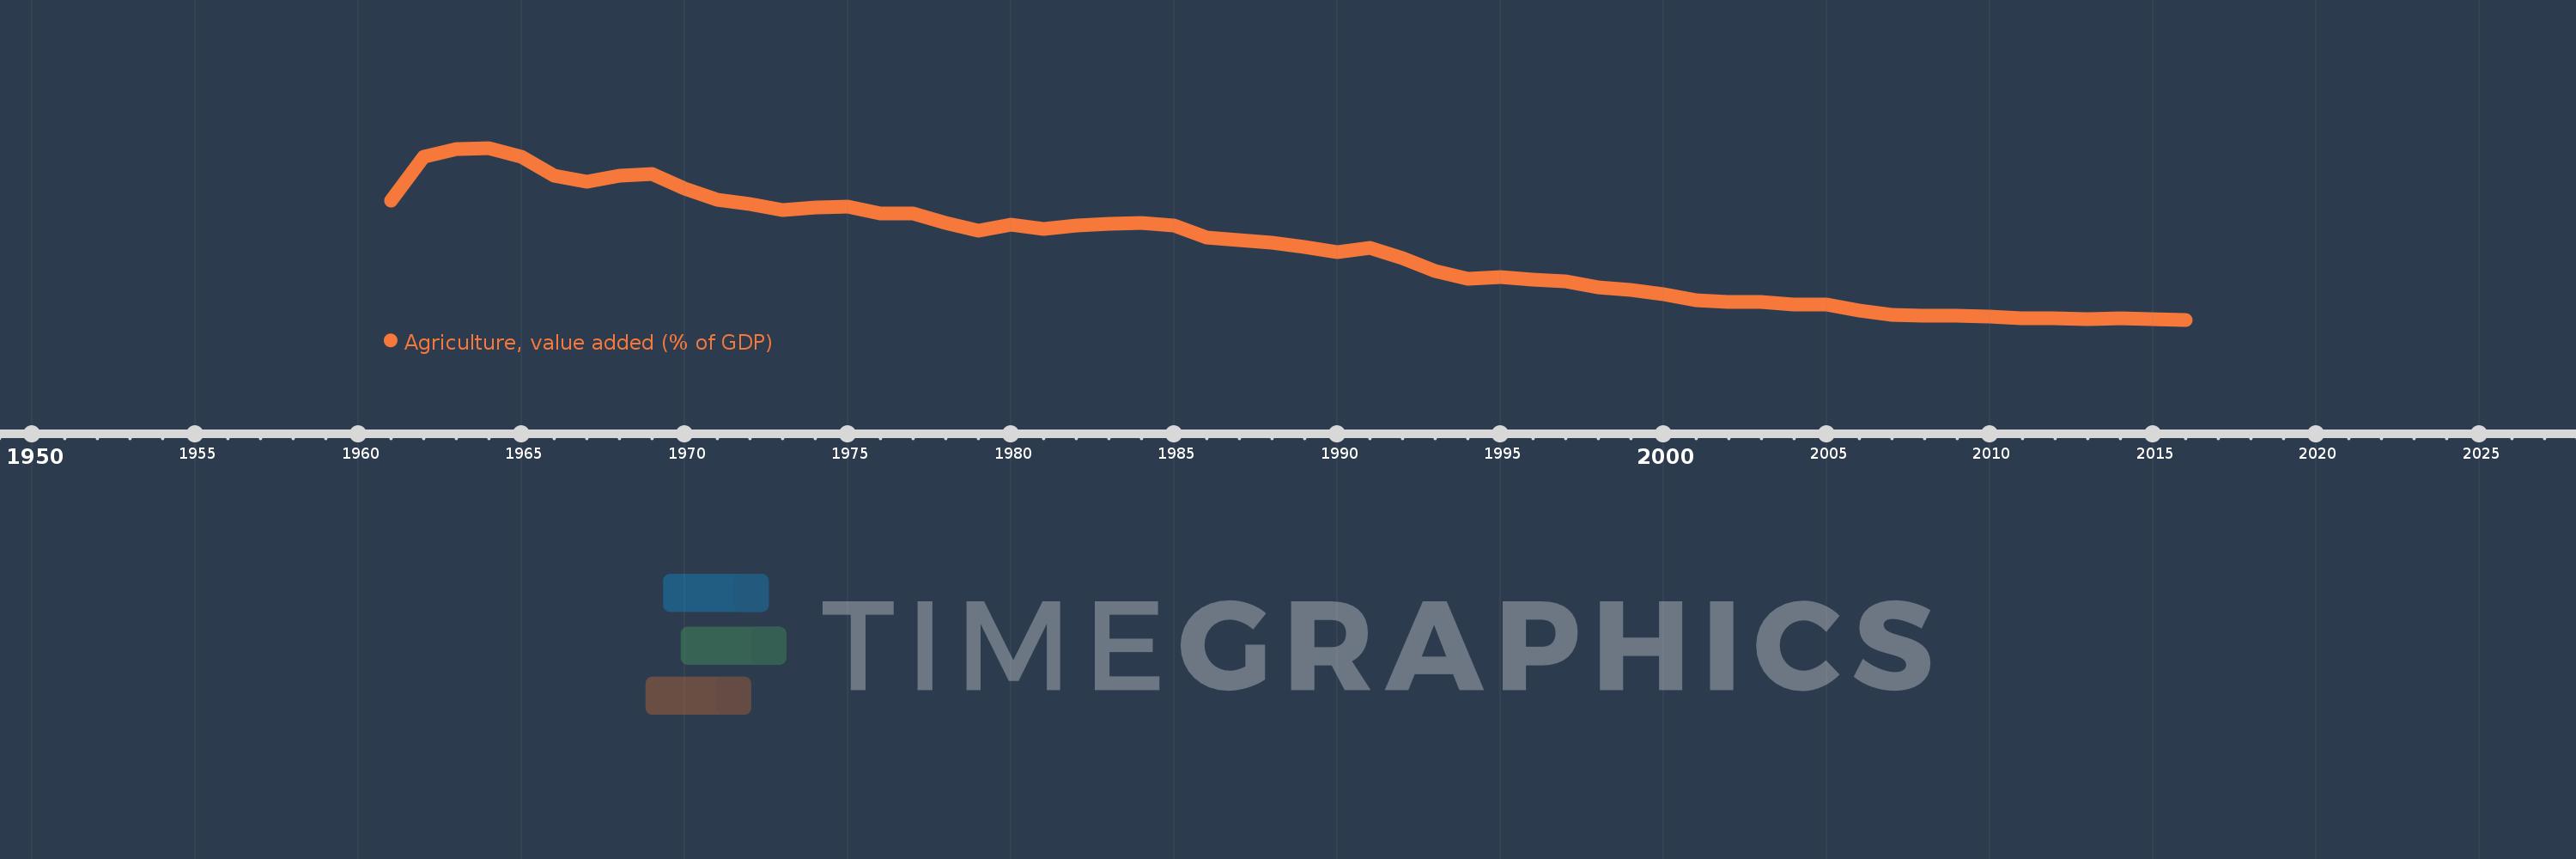
Agriculture, value added (% of GDP)
2016,2015,2014,2013,2012,2011,2010,2009,2008,2007,2006,2005,2004,2003,2002,2001,2000,1999,1998,1997,1996,1995,1994,1993,1992,1991,1990,1989,1988,1987,1986,1985,1984,1983,1982,1981,1980,1979,1978,1977,1976,1975,1974,1973,1972,1971,1970,1969,1968,1967,1966,1965,1964,1963,1962,1961
This statistics in other country:
AfghanistanAlbaniaAlgeriaAndorraAngolaAntigua and BarbudaArab WorldArgentinaArmeniaArubaAustraliaAustriaAzerbaijanBahamas, TheBahrainBangladeshBarbadosBelarusBelgiumBelizeBeninBermudaBhutanBoliviaBosnia and HerzegovinaBotswanaBrazilBrunei DarussalamBulgariaBurkina FasoBurundiCabo VerdeCambodiaCameroonCanadaCaribbean small statesCayman IslandsCentral African RepublicCentral Europe and the BalticsChadChileChinaColombiaComorosCongo, Dem. Rep.Congo, Rep.Costa RicaCote d'IvoireCroatiaCubaCyprusCzech RepublicDenmarkDjiboutiDominicaDominican RepublicEarly-demographic dividendEast Asia & PacificEast Asia & Pacific (excluding high income)East Asia & Pacific (IDA & IBRD countries)EcuadorEgypt, Arab Rep.El SalvadorEquatorial GuineaEritreaEstoniaEthiopiaEuro areaEurope & Central AsiaEurope & Central Asia (excluding high income)Europe & Central Asia (IDA & IBRD countries)European UnionFijiFinlandFragile and conflict affected situationsFranceFrench PolynesiaGabonGambia, TheGeorgiaGermanyGhanaGreeceGrenadaGuatemalaGuineaGuinea-BissauGuyanaHeavily indebted poor countries (HIPC)High incomeHondurasHong Kong SAR, ChinaHungaryIBRD onlyIcelandIDA & IBRD totalIDA blendIDA onlyIDA totalIndiaIndonesiaIran, Islamic Rep.IrelandItalyJamaicaJapanJordanKazakhstanKenyaKiribatiKorea, Rep.KosovoKuwaitKyrgyz RepublicLao PDRLate-demographic dividendLatin America & Caribbean Latin America & Caribbean (excluding high income)Latin America & the Caribbean (IDA & IBRD countries)LatviaLeast developed countries: UN classificationLebanonLesothoLibyaLithuaniaLow & middle incomeLow incomeLower middle incomeLuxembourgMacao SAR, ChinaMacedonia, FYRMadagascarMalawiMalaysiaMaldivesMaliMaltaMarshall IslandsMauritaniaMauritiusMexicoMicronesia, Fed. Sts.Middle East & North AfricaMiddle East & North Africa (excluding high income)Middle East & North Africa (IDA & IBRD countries)Middle incomeMoldovaMongoliaMontenegroMoroccoMozambiqueMyanmarNamibiaNepalNetherlandsNew CaledoniaNew ZealandNicaraguaNigerNigeriaNorth AmericaNorwayOECD membersOmanOther small statesPacific island small statesPakistanPalauPanamaPapua New GuineaParaguayPeruPhilippinesPolandPortugalPost-demographic dividendPre-demographic dividendPuerto RicoQatarRomaniaRussian FederationRwandaSao Tome and PrincipeSaudi ArabiaSenegalSerbiaSeychellesSierra LeoneSingaporeSlovak RepublicSloveniaSmall statesSolomon IslandsSomaliaSouth AfricaSouth AsiaSouth Asia (IDA & IBRD)SpainSri LankaSt. Kitts and NevisSt. LuciaSt. Vincent and the GrenadinesSub-Saharan Africa Sub-Saharan Africa (excluding high income)Sub-Saharan Africa (IDA & IBRD countries)SudanSurinameSwazilandSwedenSwitzerlandSyrian Arab RepublicTajikistanTanzaniaThailandTimor-LesteTogoTongaTrinidad and TobagoTunisiaTurkeyTurkmenistanTuvaluUgandaUkraineUnited KingdomUnited StatesUpper middle incomeUruguayUzbekistanVanuatuVenezuela, RBVietnamWest Bank and GazaWorldYemen, Rep.ZambiaZimbabwe Timeline:
This timeline shows a graph from 1961 to 2016 of Upper middle income. No data until 1960. Number of actual observations by date: 56.
Source name:
World Development Indicators
Source organization:
World Bank national accounts data, and OECD National Accounts data files.
Categories, topics:
Agriculture & Rural Development, Economy & Growth, Climate Change
Last updated:
apr 23, 2017
Indicators value changes by year
Maximum:
33.187
jan 1, 1964
At the date of observation
Value
Absolute change
Change from previous value
jan 1, 1961
25.13
+25.13
0.0%
jan 1, 1962
31.782
+6.652
26.47%
jan 1, 1963
33.06
+1.278
4.02%
jan 1, 1964
33.187
+0.127
0.38%
jan 1, 1965
31.808
-1.379
-4.15%
jan 1, 1966
28.913
-2.896
-9.1%
jan 1, 1967
28.074
-0.838
-2.9%
jan 1, 1968
28.929
+0.854
3.04%
jan 1, 1969
29.285
+0.356
1.23%
jan 1, 1970
27.021
-2.264
-7.73%
jan 1, 1971
25.358
-1.663
-6.15%
jan 1, 1972
24.647
-0.711
-2.8%
jan 1, 1973
23.795
-0.852
-3.46%
jan 1, 1974
24.104
+0.309
1.3%
jan 1, 1975
24.278
+0.174
0.72%
jan 1, 1976
23.23
-1.048
-4.32%
jan 1, 1977
23.275
+0.045
0.19%
jan 1, 1978
21.809
-1.466
-6.3%
jan 1, 1979
20.637
-1.171
-5.37%
jan 1, 1980
21.536
+0.898
4.35%
jan 1, 1981
20.87
-0.666
-3.09%
jan 1, 1982
21.467
+0.597
2.86%
jan 1, 1983
21.709
+0.242
1.13%
jan 1, 1984
21.75
+0.041
0.19%
jan 1, 1985
21.421
-0.329
-1.51%
jan 1, 1986
19.625
-1.797
-8.39%
jan 1, 1987
19.145
-0.48
-2.45%
jan 1, 1988
18.772
-0.373
-1.95%
jan 1, 1989
18.123
-0.649
-3.46%
jan 1, 1990
17.388
-0.735
-4.05%
jan 1, 1991
18.04
+0.652
3.75%
jan 1, 1992
16.436
-1.604
-8.89%
jan 1, 1993
14.508
-1.929
-11.73%
jan 1, 1994
13.384
-1.123
-7.74%
jan 1, 1995
13.589
+0.205
1.53%
jan 1, 1996
13.128
-0.461
-3.39%
jan 1, 1997
12.899
-0.229
-1.74%
jan 1, 1998
12.039
-0.861
-6.67%
jan 1, 1999
11.66
-0.379
-3.14%
jan 1, 2000
11.032
-0.628
-5.39%
jan 1, 2001
10.075
-0.957
-8.68%
jan 1, 2002
9.777
-0.298
-2.95%
jan 1, 2003
9.747
-0.03
-0.31%
jan 1, 2004
9.45
-0.296
-3.04%
jan 1, 2005
9.412
-0.039
-0.41%
jan 1, 2006
8.479
-0.932
-9.9%
jan 1, 2007
7.835
-0.644
-7.6%
jan 1, 2008
7.664
-0.172
-2.19%
jan 1, 2009
7.65
-0.014
-0.18%
jan 1, 2010
7.552
-0.099
-1.29%
jan 1, 2011
7.361
-0.191
-2.53%
jan 1, 2012
7.333
-0.028
-0.38%
jan 1, 2013
7.224
-0.109
-1.49%
jan 1, 2014
7.265
+0.041
0.57%
jan 1, 2015
7.199
-0.067
-0.92%
jan 1, 2016
7.098
-0.1
-1.39%
Ranking of countries by current statistics by years


Comments: