29
/
en
AIzaSyAYiBZKx7MnpbEhh9jyipgxe19OcubqV5w
April 1, 2024
97020
Cabo Verde
CPV
true
2
1
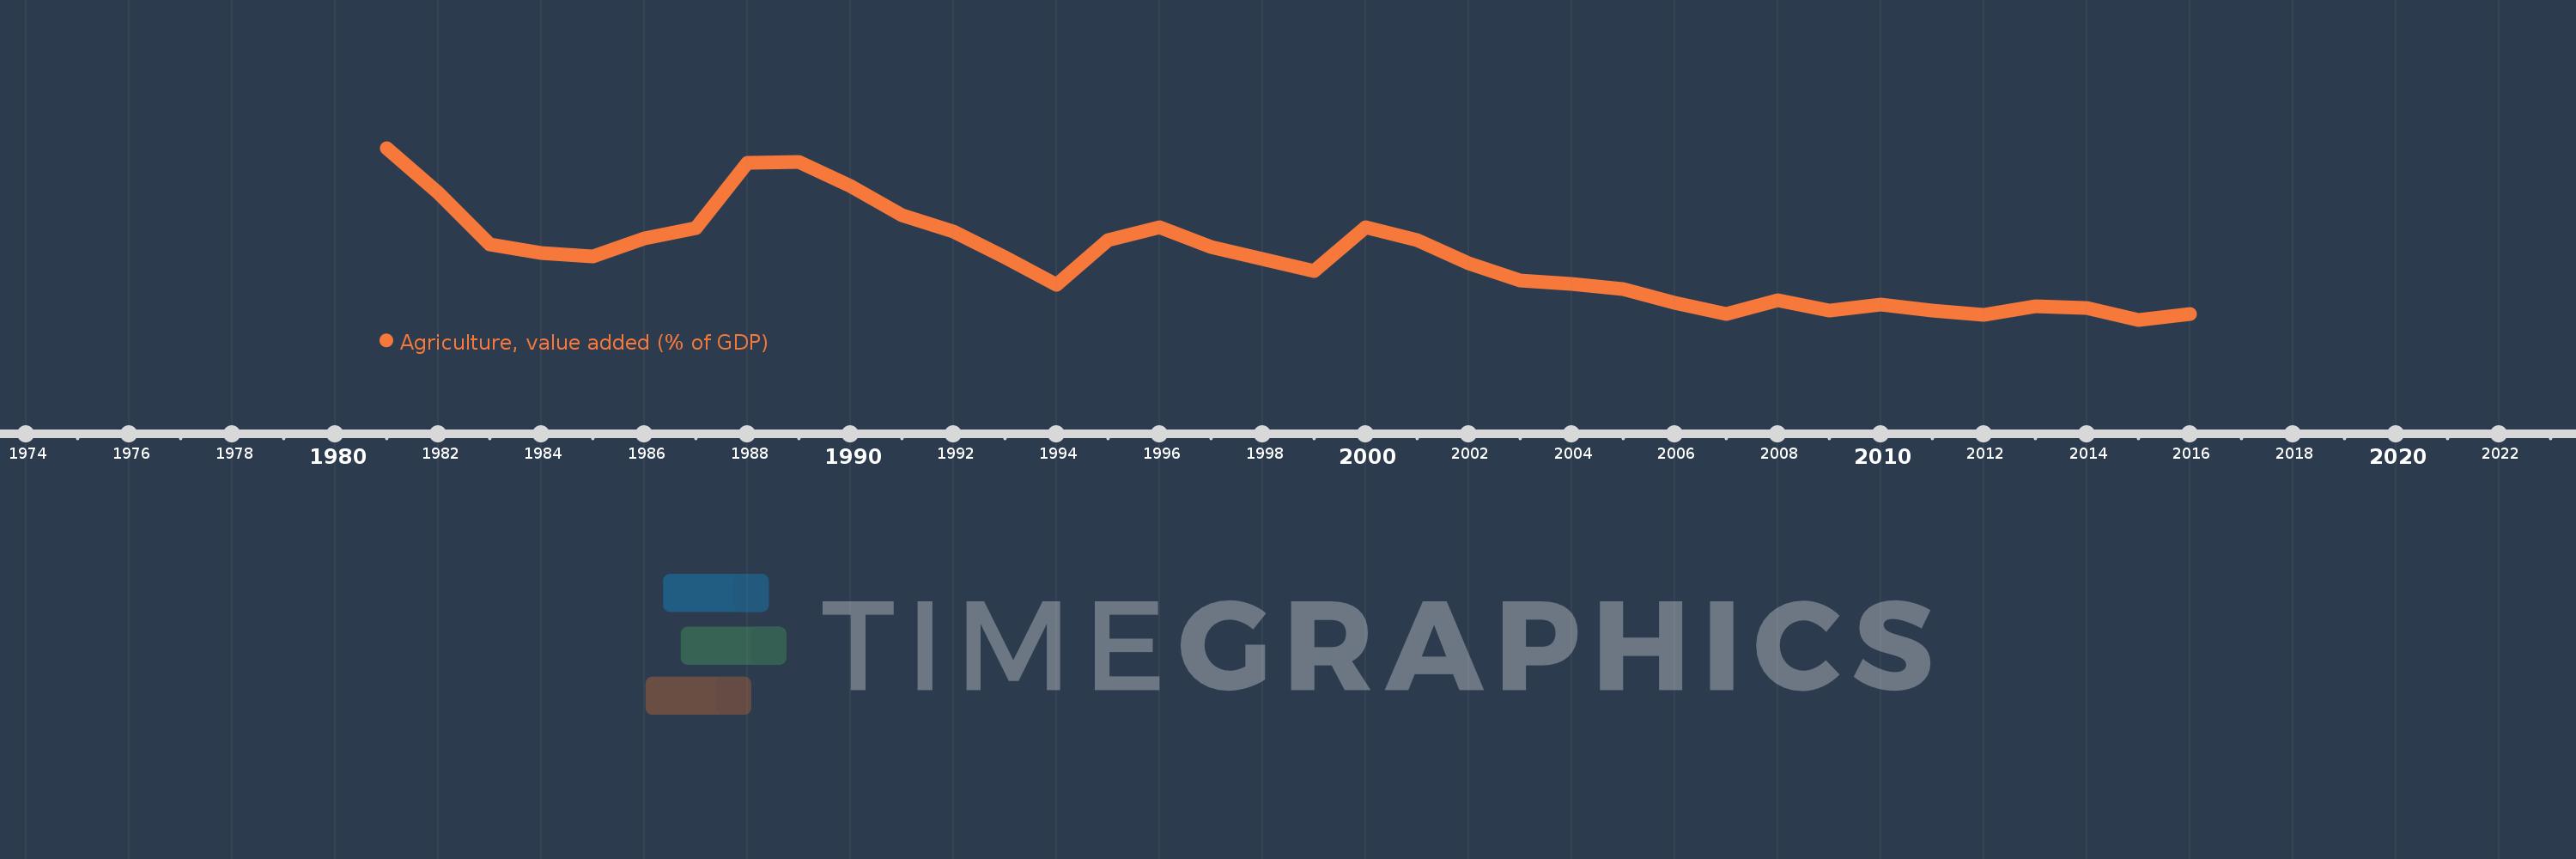
Agriculture, value added (% of GDP)
2016,2015,2014,2013,2012,2011,2010,2009,2008,2007,2006,2005,2004,2003,2002,2001,2000,1999,1998,1997,1996,1995,1994,1993,1992,1991,1990,1989,1988,1987,1986,1985,1984,1983,1982,1981
This statistics in other country:
AfghanistanAlbaniaAlgeriaAndorraAngolaAntigua and BarbudaArab WorldArgentinaArmeniaArubaAustraliaAustriaAzerbaijanBahamas, TheBahrainBangladeshBarbadosBelarusBelgiumBelizeBeninBermudaBhutanBoliviaBosnia and HerzegovinaBotswanaBrazilBrunei DarussalamBulgariaBurkina FasoBurundiCabo VerdeCambodiaCameroonCanadaCaribbean small statesCayman IslandsCentral African RepublicCentral Europe and the BalticsChadChileChinaColombiaComorosCongo, Dem. Rep.Congo, Rep.Costa RicaCote d'IvoireCroatiaCubaCyprusCzech RepublicDenmarkDjiboutiDominicaDominican RepublicEarly-demographic dividendEast Asia & PacificEast Asia & Pacific (excluding high income)East Asia & Pacific (IDA & IBRD countries)EcuadorEgypt, Arab Rep.El SalvadorEquatorial GuineaEritreaEstoniaEthiopiaEuro areaEurope & Central AsiaEurope & Central Asia (excluding high income)Europe & Central Asia (IDA & IBRD countries)European UnionFijiFinlandFragile and conflict affected situationsFranceFrench PolynesiaGabonGambia, TheGeorgiaGermanyGhanaGreeceGrenadaGuatemalaGuineaGuinea-BissauGuyanaHeavily indebted poor countries (HIPC)High incomeHondurasHong Kong SAR, ChinaHungaryIBRD onlyIcelandIDA & IBRD totalIDA blendIDA onlyIDA totalIndiaIndonesiaIran, Islamic Rep.IrelandItalyJamaicaJapanJordanKazakhstanKenyaKiribatiKorea, Rep.KosovoKuwaitKyrgyz RepublicLao PDRLate-demographic dividendLatin America & Caribbean Latin America & Caribbean (excluding high income)Latin America & the Caribbean (IDA & IBRD countries)LatviaLeast developed countries: UN classificationLebanonLesothoLibyaLithuaniaLow & middle incomeLow incomeLower middle incomeLuxembourgMacao SAR, ChinaMacedonia, FYRMadagascarMalawiMalaysiaMaldivesMaliMaltaMarshall IslandsMauritaniaMauritiusMexicoMicronesia, Fed. Sts.Middle East & North AfricaMiddle East & North Africa (excluding high income)Middle East & North Africa (IDA & IBRD countries)Middle incomeMoldovaMongoliaMontenegroMoroccoMozambiqueMyanmarNamibiaNepalNetherlandsNew CaledoniaNew ZealandNicaraguaNigerNigeriaNorth AmericaNorwayOECD membersOmanOther small statesPacific island small statesPakistanPalauPanamaPapua New GuineaParaguayPeruPhilippinesPolandPortugalPost-demographic dividendPre-demographic dividendPuerto RicoQatarRomaniaRussian FederationRwandaSao Tome and PrincipeSaudi ArabiaSenegalSerbiaSeychellesSierra LeoneSingaporeSlovak RepublicSloveniaSmall statesSolomon IslandsSomaliaSouth AfricaSouth AsiaSouth Asia (IDA & IBRD)SpainSri LankaSt. Kitts and NevisSt. LuciaSt. Vincent and the GrenadinesSub-Saharan Africa Sub-Saharan Africa (excluding high income)Sub-Saharan Africa (IDA & IBRD countries)SudanSurinameSwazilandSwedenSwitzerlandSyrian Arab RepublicTajikistanTanzaniaThailandTimor-LesteTogoTongaTrinidad and TobagoTunisiaTurkeyTurkmenistanTuvaluUgandaUkraineUnited KingdomUnited StatesUpper middle incomeUruguayUzbekistanVanuatuVenezuela, RBVietnamWest Bank and GazaWorldYemen, Rep.ZambiaZimbabwe Timeline:
This timeline shows a graph from 1981 to 2016 of Cabo Verde. No data until 1980. Number of actual observations by date: 36.
Source name:
World Development Indicators
Source organization:
World Bank national accounts data, and OECD National Accounts data files.
Categories, topics:
Agriculture & Rural Development, Economy & Growth, Climate Change
Last updated:
apr 23, 2017
Indicators value changes by year
At the date of observation
Value
Absolute change
Change from previous value
jan 1, 1981
18.56
+18.56
0.0%
jan 1, 1982
15.773
-2.787
-15.02%
jan 1, 1983
12.58
-3.193
-20.24%
jan 1, 1984
12.057
-0.523
-4.16%
jan 1, 1985
11.856
-0.2
-1.66%
jan 1, 1986
12.99
+1.133
9.56%
jan 1, 1987
13.631
+0.642
4.94%
jan 1, 1988
17.646
+4.015
29.45%
jan 1, 1989
17.697
+0.05
0.29%
jan 1, 1990
16.211
-1.486
-8.4%
jan 1, 1991
14.391
-1.82
-11.23%
jan 1, 1992
13.393
-0.998
-6.93%
jan 1, 1993
11.794
-1.599
-11.94%
jan 1, 1994
10.136
-1.658
-14.06%
jan 1, 1995
12.859
+2.723
26.86%
jan 1, 1996
13.681
+0.822
6.39%
jan 1, 1997
12.448
-1.232
-9.01%
jan 1, 1998
11.681
-0.768
-6.17%
jan 1, 1999
10.947
-0.733
-6.28%
jan 1, 2000
13.643
+2.696
24.63%
jan 1, 2001
12.872
-0.772
-5.66%
jan 1, 2002
11.416
-1.456
-11.31%
jan 1, 2003
10.351
-1.064
-9.32%
jan 1, 2004
10.144
-0.208
-2.01%
jan 1, 2005
9.863
-0.28
-2.76%
jan 1, 2006
9.001
-0.862
-8.74%
jan 1, 2007
8.319
-0.682
-7.58%
jan 1, 2008
9.175
+0.856
10.3%
jan 1, 2009
8.505
-0.67
-7.31%
jan 1, 2010
8.888
+0.384
4.51%
jan 1, 2011
8.501
-0.388
-4.36%
jan 1, 2012
8.257
-0.244
-2.87%
jan 1, 2013
8.812
+0.555
6.72%
jan 1, 2014
8.666
-0.146
-1.66%
jan 1, 2015
7.954
-0.712
-8.22%
jan 1, 2016
8.314
+0.36
4.53%
Ranking of countries by current statistics by years


Comments: