29
/
en
AIzaSyAYiBZKx7MnpbEhh9jyipgxe19OcubqV5w
April 1, 2024
130084
Ethiopia
ETH
true
2
1
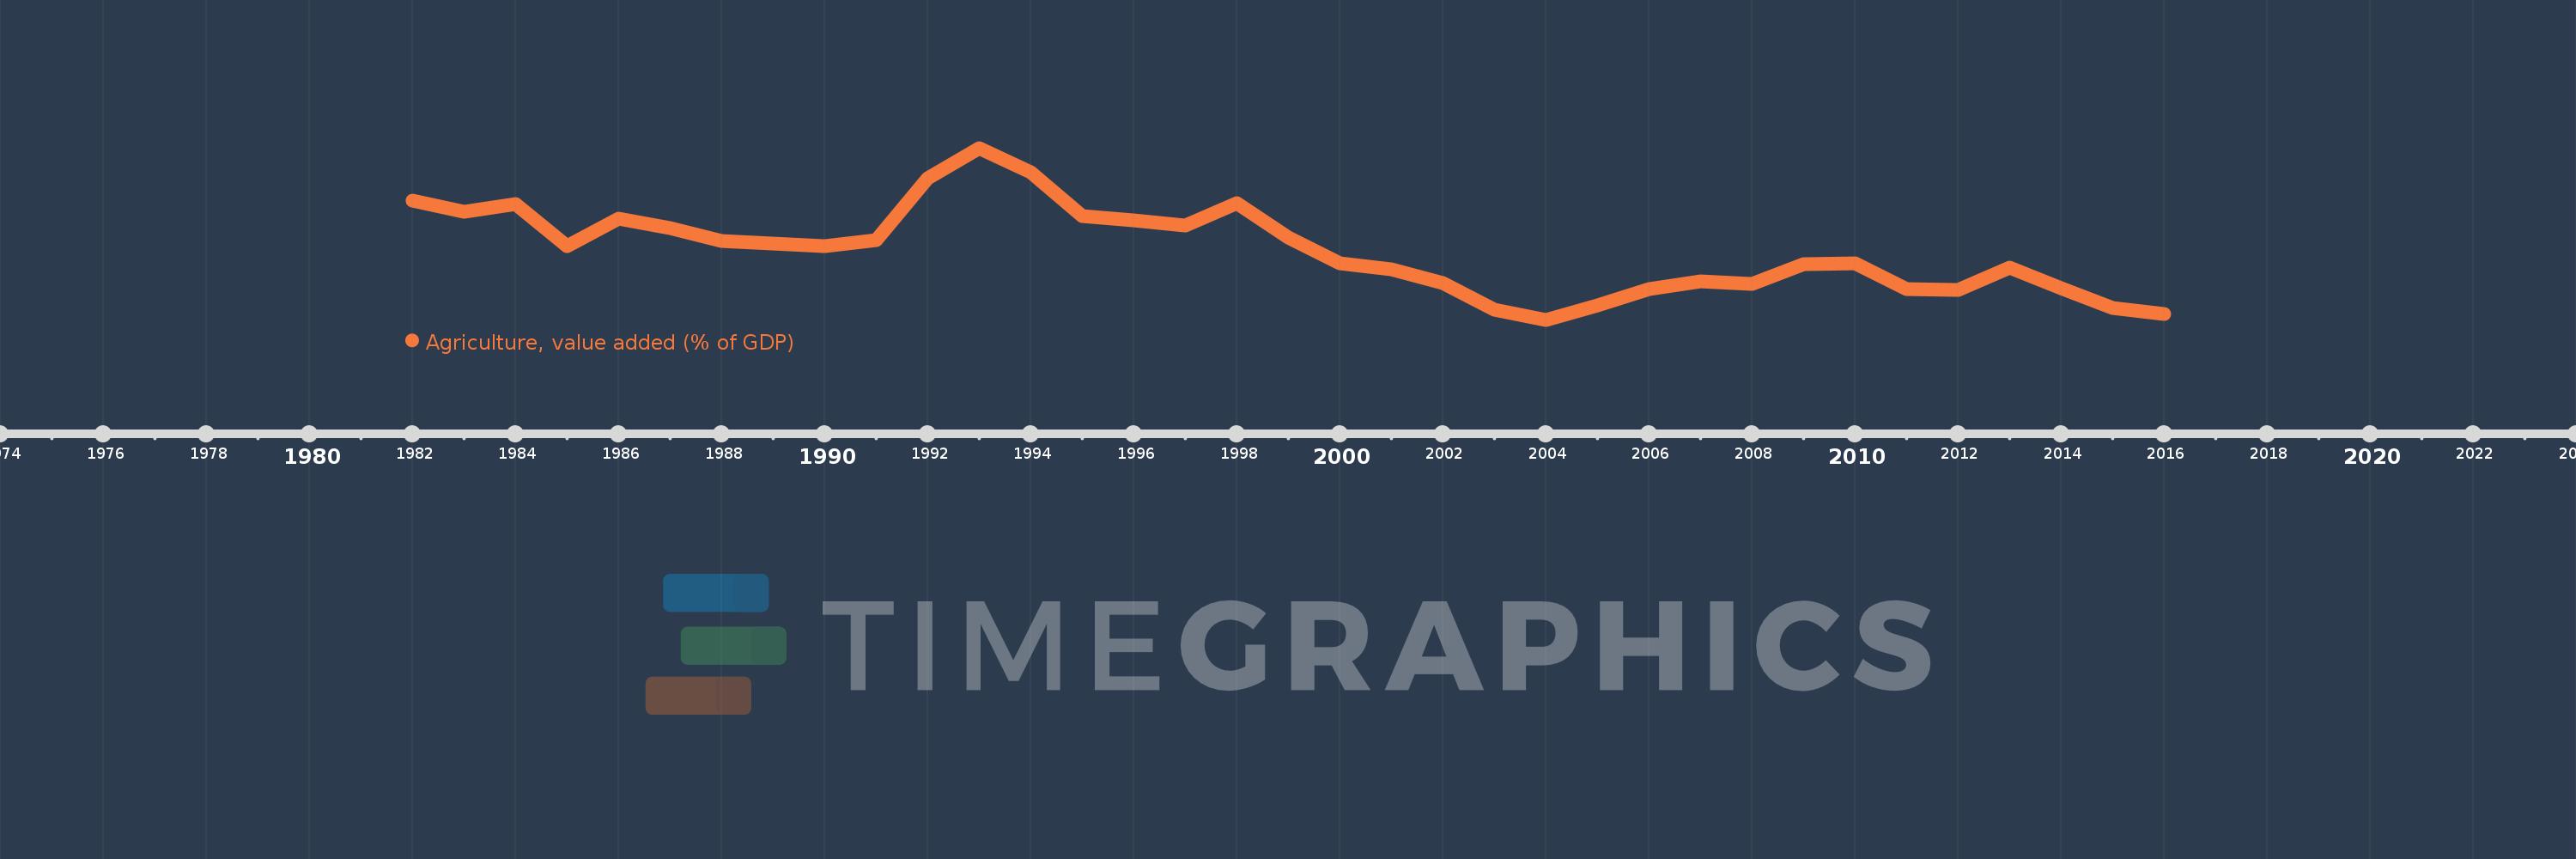
Agriculture, value added (% of GDP)
2016,2015,2014,2013,2012,2011,2010,2009,2008,2007,2006,2005,2004,2003,2002,2001,2000,1999,1998,1997,1996,1995,1994,1993,1992,1991,1990,1989,1988,1987,1986,1985,1984,1983,1982
This statistics in other country:
AfghanistanAlbaniaAlgeriaAndorraAngolaAntigua and BarbudaArab WorldArgentinaArmeniaArubaAustraliaAustriaAzerbaijanBahamas, TheBahrainBangladeshBarbadosBelarusBelgiumBelizeBeninBermudaBhutanBoliviaBosnia and HerzegovinaBotswanaBrazilBrunei DarussalamBulgariaBurkina FasoBurundiCabo VerdeCambodiaCameroonCanadaCaribbean small statesCayman IslandsCentral African RepublicCentral Europe and the BalticsChadChileChinaColombiaComorosCongo, Dem. Rep.Congo, Rep.Costa RicaCote d'IvoireCroatiaCubaCyprusCzech RepublicDenmarkDjiboutiDominicaDominican RepublicEarly-demographic dividendEast Asia & PacificEast Asia & Pacific (excluding high income)East Asia & Pacific (IDA & IBRD countries)EcuadorEgypt, Arab Rep.El SalvadorEquatorial GuineaEritreaEstoniaEthiopiaEuro areaEurope & Central AsiaEurope & Central Asia (excluding high income)Europe & Central Asia (IDA & IBRD countries)European UnionFijiFinlandFragile and conflict affected situationsFranceFrench PolynesiaGabonGambia, TheGeorgiaGermanyGhanaGreeceGrenadaGuatemalaGuineaGuinea-BissauGuyanaHeavily indebted poor countries (HIPC)High incomeHondurasHong Kong SAR, ChinaHungaryIBRD onlyIcelandIDA & IBRD totalIDA blendIDA onlyIDA totalIndiaIndonesiaIran, Islamic Rep.IrelandItalyJamaicaJapanJordanKazakhstanKenyaKiribatiKorea, Rep.KosovoKuwaitKyrgyz RepublicLao PDRLate-demographic dividendLatin America & Caribbean Latin America & Caribbean (excluding high income)Latin America & the Caribbean (IDA & IBRD countries)LatviaLeast developed countries: UN classificationLebanonLesothoLibyaLithuaniaLow & middle incomeLow incomeLower middle incomeLuxembourgMacao SAR, ChinaMacedonia, FYRMadagascarMalawiMalaysiaMaldivesMaliMaltaMarshall IslandsMauritaniaMauritiusMexicoMicronesia, Fed. Sts.Middle East & North AfricaMiddle East & North Africa (excluding high income)Middle East & North Africa (IDA & IBRD countries)Middle incomeMoldovaMongoliaMontenegroMoroccoMozambiqueMyanmarNamibiaNepalNetherlandsNew CaledoniaNew ZealandNicaraguaNigerNigeriaNorth AmericaNorwayOECD membersOmanOther small statesPacific island small statesPakistanPalauPanamaPapua New GuineaParaguayPeruPhilippinesPolandPortugalPost-demographic dividendPre-demographic dividendPuerto RicoQatarRomaniaRussian FederationRwandaSao Tome and PrincipeSaudi ArabiaSenegalSerbiaSeychellesSierra LeoneSingaporeSlovak RepublicSloveniaSmall statesSolomon IslandsSomaliaSouth AfricaSouth AsiaSouth Asia (IDA & IBRD)SpainSri LankaSt. Kitts and NevisSt. LuciaSt. Vincent and the GrenadinesSub-Saharan Africa Sub-Saharan Africa (excluding high income)Sub-Saharan Africa (IDA & IBRD countries)SudanSurinameSwazilandSwedenSwitzerlandSyrian Arab RepublicTajikistanTanzaniaThailandTimor-LesteTogoTongaTrinidad and TobagoTunisiaTurkeyTurkmenistanTuvaluUgandaUkraineUnited KingdomUnited StatesUpper middle incomeUruguayUzbekistanVanuatuVenezuela, RBVietnamWest Bank and GazaWorldYemen, Rep.ZambiaZimbabwe Timeline:
This timeline shows a graph from 1982 to 2016 of Ethiopia. No data until 1981. Number of actual observations by date: 35.
Source name:
World Development Indicators
Source organization:
World Bank national accounts data, and OECD National Accounts data files.
Categories, topics:
Agriculture & Rural Development, Economy & Growth, Climate Change
Last updated:
apr 23, 2017
Indicators value changes by year
Maximum:
65.973
jan 1, 1993
At the date of observation
Value
Absolute change
Change from previous value
jan 1, 1982
58.081
+58.081
0.0%
jan 1, 1983
56.333
-1.748
-3.01%
jan 1, 1984
57.468
+1.135
2.01%
jan 1, 1985
51.18
-6.288
-10.94%
jan 1, 1986
55.37
+4.191
8.19%
jan 1, 1987
53.923
-1.448
-2.61%
jan 1, 1988
51.952
-1.971
-3.65%
jan 1, 1989
51.574
-0.378
-0.73%
jan 1, 1990
51.213
-0.361
-0.7%
jan 1, 1991
52.041
+0.828
1.62%
jan 1, 1992
61.356
+9.316
17.9%
jan 1, 1993
65.973
+4.617
7.52%
jan 1, 1994
62.373
-3.6
-5.46%
jan 1, 1995
55.66
-6.713
-10.76%
jan 1, 1996
55.039
-0.622
-1.12%
jan 1, 1997
54.302
-0.736
-1.34%
jan 1, 1998
57.723
+3.421
6.3%
jan 1, 1999
52.488
-5.235
-9.07%
jan 1, 2000
48.627
-3.861
-7.36%
jan 1, 2001
47.759
-0.869
-1.79%
jan 1, 2002
45.641
-2.117
-4.43%
jan 1, 2003
41.66
-3.981
-8.72%
jan 1, 2004
40.12
-1.541
-3.7%
jan 1, 2005
42.301
+2.182
5.44%
jan 1, 2006
44.702
+2.401
5.68%
jan 1, 2007
45.878
+1.176
2.63%
jan 1, 2008
45.462
-0.417
-0.91%
jan 1, 2009
48.434
+2.972
6.54%
jan 1, 2010
48.637
+0.203
0.42%
jan 1, 2011
44.741
-3.896
-8.01%
jan 1, 2012
44.67
-0.072
-0.16%
jan 1, 2013
47.983
+3.314
7.42%
jan 1, 2014
44.897
-3.086
-6.43%
jan 1, 2015
41.923
-2.974
-6.62%
jan 1, 2016
40.973
-0.95
-2.27%
Ranking of countries by current statistics by years


Comments: