29
/
en
AIzaSyAYiBZKx7MnpbEhh9jyipgxe19OcubqV5w
April 1, 2024
49796
Middle East & North Africa (IDA & IBRD countries)
TMN
false
2
1
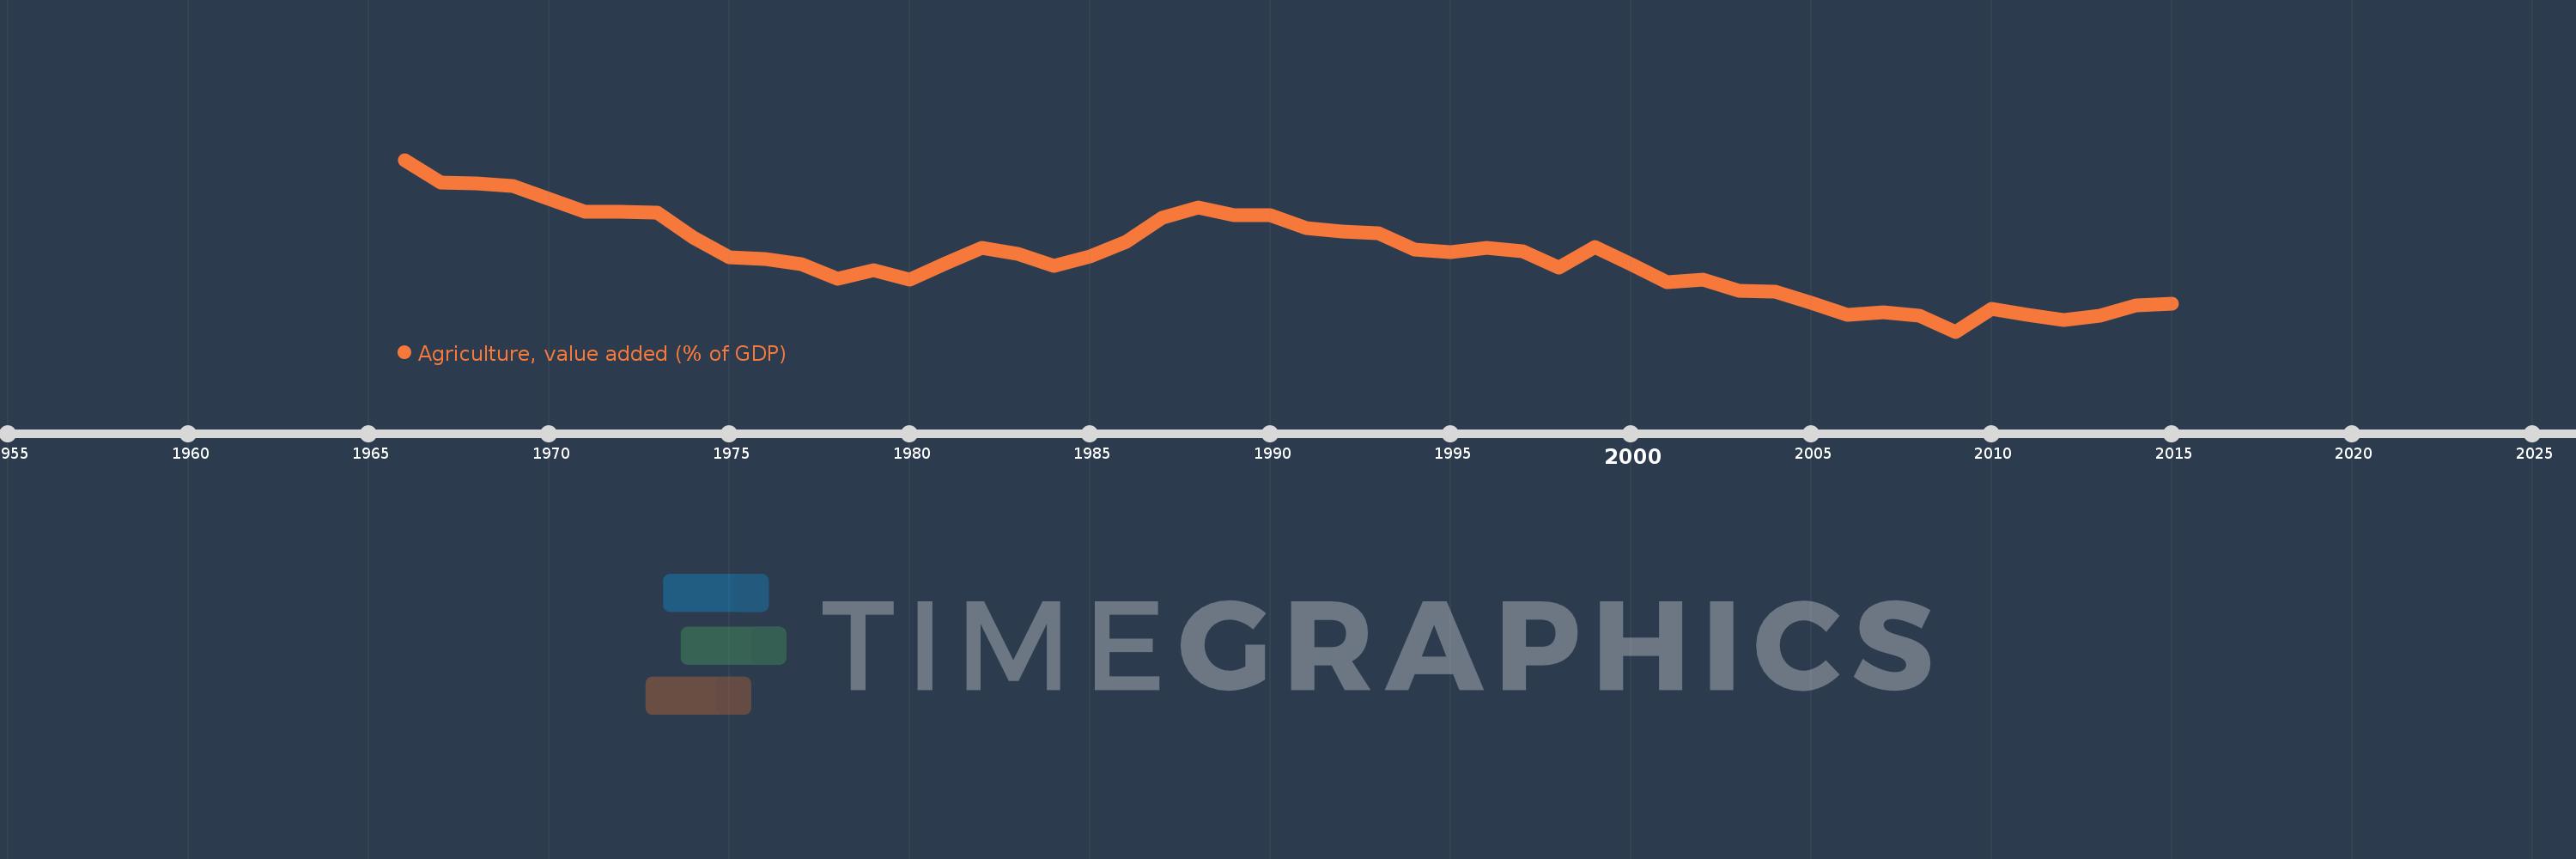
Agriculture, value added (% of GDP)
2015,2014,2013,2012,2011,2010,2009,2008,2007,2006,2005,2004,2003,2002,2001,2000,1999,1998,1997,1996,1995,1994,1993,1992,1991,1990,1989,1988,1987,1986,1985,1984,1983,1982,1981,1980,1979,1978,1977,1976,1975,1974,1973,1972,1971,1970,1969,1968,1967,1966
This statistics in other country:
AfghanistanAlbaniaAlgeriaAndorraAngolaAntigua and BarbudaArab WorldArgentinaArmeniaArubaAustraliaAustriaAzerbaijanBahamas, TheBahrainBangladeshBarbadosBelarusBelgiumBelizeBeninBermudaBhutanBoliviaBosnia and HerzegovinaBotswanaBrazilBrunei DarussalamBulgariaBurkina FasoBurundiCabo VerdeCambodiaCameroonCanadaCaribbean small statesCayman IslandsCentral African RepublicCentral Europe and the BalticsChadChileChinaColombiaComorosCongo, Dem. Rep.Congo, Rep.Costa RicaCote d'IvoireCroatiaCubaCyprusCzech RepublicDenmarkDjiboutiDominicaDominican RepublicEarly-demographic dividendEast Asia & PacificEast Asia & Pacific (excluding high income)East Asia & Pacific (IDA & IBRD countries)EcuadorEgypt, Arab Rep.El SalvadorEquatorial GuineaEritreaEstoniaEthiopiaEuro areaEurope & Central AsiaEurope & Central Asia (excluding high income)Europe & Central Asia (IDA & IBRD countries)European UnionFijiFinlandFragile and conflict affected situationsFranceFrench PolynesiaGabonGambia, TheGeorgiaGermanyGhanaGreeceGrenadaGuatemalaGuineaGuinea-BissauGuyanaHeavily indebted poor countries (HIPC)High incomeHondurasHong Kong SAR, ChinaHungaryIBRD onlyIcelandIDA & IBRD totalIDA blendIDA onlyIDA totalIndiaIndonesiaIran, Islamic Rep.IrelandItalyJamaicaJapanJordanKazakhstanKenyaKiribatiKorea, Rep.KosovoKuwaitKyrgyz RepublicLao PDRLate-demographic dividendLatin America & Caribbean Latin America & Caribbean (excluding high income)Latin America & the Caribbean (IDA & IBRD countries)LatviaLeast developed countries: UN classificationLebanonLesothoLibyaLithuaniaLow & middle incomeLow incomeLower middle incomeLuxembourgMacao SAR, ChinaMacedonia, FYRMadagascarMalawiMalaysiaMaldivesMaliMaltaMarshall IslandsMauritaniaMauritiusMexicoMicronesia, Fed. Sts.Middle East & North AfricaMiddle East & North Africa (excluding high income)Middle East & North Africa (IDA & IBRD countries)Middle incomeMoldovaMongoliaMontenegroMoroccoMozambiqueMyanmarNamibiaNepalNetherlandsNew CaledoniaNew ZealandNicaraguaNigerNigeriaNorth AmericaNorwayOECD membersOmanOther small statesPacific island small statesPakistanPalauPanamaPapua New GuineaParaguayPeruPhilippinesPolandPortugalPost-demographic dividendPre-demographic dividendPuerto RicoQatarRomaniaRussian FederationRwandaSao Tome and PrincipeSaudi ArabiaSenegalSerbiaSeychellesSierra LeoneSingaporeSlovak RepublicSloveniaSmall statesSolomon IslandsSomaliaSouth AfricaSouth AsiaSouth Asia (IDA & IBRD)SpainSri LankaSt. Kitts and NevisSt. LuciaSt. Vincent and the GrenadinesSub-Saharan Africa Sub-Saharan Africa (excluding high income)Sub-Saharan Africa (IDA & IBRD countries)SudanSurinameSwazilandSwedenSwitzerlandSyrian Arab RepublicTajikistanTanzaniaThailandTimor-LesteTogoTongaTrinidad and TobagoTunisiaTurkeyTurkmenistanTuvaluUgandaUkraineUnited KingdomUnited StatesUpper middle incomeUruguayUzbekistanVanuatuVenezuela, RBVietnamWest Bank and GazaWorldYemen, Rep.ZambiaZimbabwe Timeline:
This timeline shows a graph from 1966 to 2015 of Middle East & North Africa (IDA & IBRD countries). No data until 1965. Number of actual observations by date: 50.
Source name:
World Development Indicators
Source organization:
World Bank national accounts data, and OECD National Accounts data files.
Categories, topics:
Agriculture & Rural Development, Economy & Growth, Climate Change
Last updated:
apr 23, 2017
Indicators value changes by year
Maximum:
20.494
jan 1, 1966
At the date of observation
Value
Absolute change
Change from previous value
jan 1, 1966
20.494
+20.494
0.0%
jan 1, 1967
18.837
-1.656
-8.08%
jan 1, 1968
18.747
-0.09
-0.48%
jan 1, 1969
18.577
-0.17
-0.91%
jan 1, 1970
17.609
-0.968
-5.21%
jan 1, 1971
16.723
-0.886
-5.03%
jan 1, 1972
16.72
-0.004
-0.02%
jan 1, 1973
16.617
-0.103
-0.61%
jan 1, 1974
14.837
-1.78
-10.71%
jan 1, 1975
13.347
-1.49
-10.04%
jan 1, 1976
13.208
-0.139
-1.04%
jan 1, 1977
12.843
-0.365
-2.76%
jan 1, 1978
11.811
-1.032
-8.04%
jan 1, 1979
12.449
+0.638
5.4%
jan 1, 1980
11.742
-0.707
-5.68%
jan 1, 1981
12.917
+1.175
10.01%
jan 1, 1982
14.037
+1.12
8.67%
jan 1, 1983
13.598
-0.439
-3.13%
jan 1, 1984
12.735
-0.864
-6.35%
jan 1, 1985
13.398
+0.664
5.21%
jan 1, 1986
14.501
+1.103
8.23%
jan 1, 1987
16.262
+1.761
12.14%
jan 1, 1988
16.978
+0.716
4.4%
jan 1, 1989
16.429
-0.548
-3.23%
jan 1, 1990
16.444
+0.015
0.09%
jan 1, 1991
15.5
-0.944
-5.74%
jan 1, 1992
15.239
-0.261
-1.68%
jan 1, 1993
15.127
-0.112
-0.74%
jan 1, 1994
13.928
-1.199
-7.93%
jan 1, 1995
13.743
-0.185
-1.33%
jan 1, 1996
14.084
+0.341
2.48%
jan 1, 1997
13.827
-0.256
-1.82%
jan 1, 1998
12.638
-1.19
-8.6%
jan 1, 1999
14.144
+1.506
11.92%
jan 1, 2000
12.878
-1.266
-8.95%
jan 1, 2001
11.569
-1.309
-10.16%
jan 1, 2002
11.698
+0.129
1.12%
jan 1, 2003
10.933
-0.765
-6.54%
jan 1, 2004
10.825
-0.109
-0.99%
jan 1, 2005
10.011
-0.813
-7.51%
jan 1, 2006
9.138
-0.873
-8.72%
jan 1, 2007
9.338
+0.2
2.19%
jan 1, 2008
9.083
-0.255
-2.73%
jan 1, 2009
7.928
-1.156
-12.72%
jan 1, 2010
9.574
+1.647
20.77%
jan 1, 2011
9.166
-0.408
-4.26%
jan 1, 2012
8.798
-0.368
-4.02%
jan 1, 2013
9.09
+0.292
3.32%
jan 1, 2014
9.873
+0.782
8.61%
jan 1, 2015
9.961
+0.088
0.89%
Ranking of countries by current statistics by years


Comments: