29
/
en
AIzaSyAYiBZKx7MnpbEhh9jyipgxe19OcubqV5w
April 1, 2024
214032
Norway
NOR
true
2
1
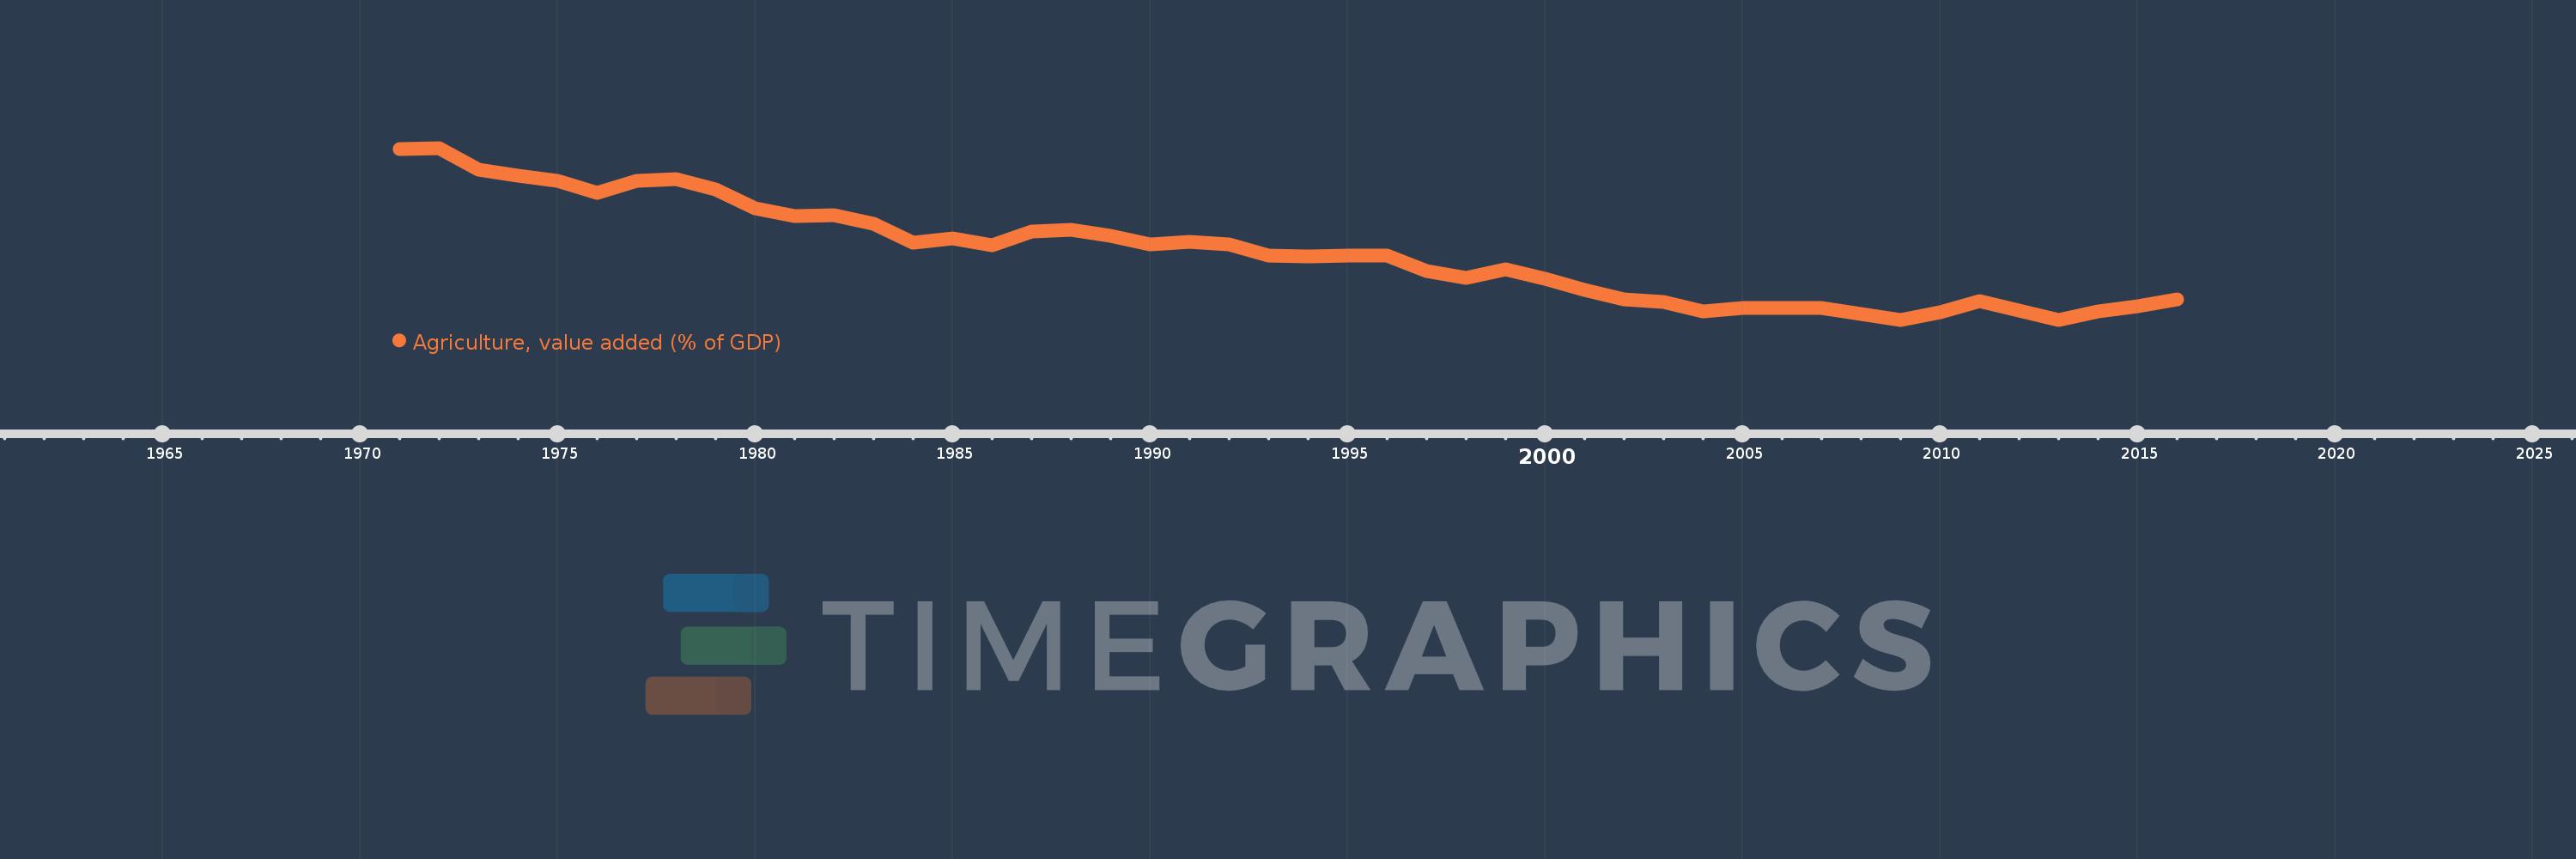
Agriculture, value added (% of GDP)
2016,2015,2014,2013,2012,2011,2010,2009,2008,2007,2006,2005,2004,2003,2002,2001,2000,1999,1998,1997,1996,1995,1994,1993,1992,1991,1990,1989,1988,1987,1986,1985,1984,1983,1982,1981,1980,1979,1978,1977,1976,1975,1974,1973,1972,1971
This statistics in other country:
AfghanistanAlbaniaAlgeriaAndorraAngolaAntigua and BarbudaArab WorldArgentinaArmeniaArubaAustraliaAustriaAzerbaijanBahamas, TheBahrainBangladeshBarbadosBelarusBelgiumBelizeBeninBermudaBhutanBoliviaBosnia and HerzegovinaBotswanaBrazilBrunei DarussalamBulgariaBurkina FasoBurundiCabo VerdeCambodiaCameroonCanadaCaribbean small statesCayman IslandsCentral African RepublicCentral Europe and the BalticsChadChileChinaColombiaComorosCongo, Dem. Rep.Congo, Rep.Costa RicaCote d'IvoireCroatiaCubaCyprusCzech RepublicDenmarkDjiboutiDominicaDominican RepublicEarly-demographic dividendEast Asia & PacificEast Asia & Pacific (excluding high income)East Asia & Pacific (IDA & IBRD countries)EcuadorEgypt, Arab Rep.El SalvadorEquatorial GuineaEritreaEstoniaEthiopiaEuro areaEurope & Central AsiaEurope & Central Asia (excluding high income)Europe & Central Asia (IDA & IBRD countries)European UnionFijiFinlandFragile and conflict affected situationsFranceFrench PolynesiaGabonGambia, TheGeorgiaGermanyGhanaGreeceGrenadaGuatemalaGuineaGuinea-BissauGuyanaHeavily indebted poor countries (HIPC)High incomeHondurasHong Kong SAR, ChinaHungaryIBRD onlyIcelandIDA & IBRD totalIDA blendIDA onlyIDA totalIndiaIndonesiaIran, Islamic Rep.IrelandItalyJamaicaJapanJordanKazakhstanKenyaKiribatiKorea, Rep.KosovoKuwaitKyrgyz RepublicLao PDRLate-demographic dividendLatin America & Caribbean Latin America & Caribbean (excluding high income)Latin America & the Caribbean (IDA & IBRD countries)LatviaLeast developed countries: UN classificationLebanonLesothoLibyaLithuaniaLow & middle incomeLow incomeLower middle incomeLuxembourgMacao SAR, ChinaMacedonia, FYRMadagascarMalawiMalaysiaMaldivesMaliMaltaMarshall IslandsMauritaniaMauritiusMexicoMicronesia, Fed. Sts.Middle East & North AfricaMiddle East & North Africa (excluding high income)Middle East & North Africa (IDA & IBRD countries)Middle incomeMoldovaMongoliaMontenegroMoroccoMozambiqueMyanmarNamibiaNepalNetherlandsNew CaledoniaNew ZealandNicaraguaNigerNigeriaNorth AmericaNorwayOECD membersOmanOther small statesPacific island small statesPakistanPalauPanamaPapua New GuineaParaguayPeruPhilippinesPolandPortugalPost-demographic dividendPre-demographic dividendPuerto RicoQatarRomaniaRussian FederationRwandaSao Tome and PrincipeSaudi ArabiaSenegalSerbiaSeychellesSierra LeoneSingaporeSlovak RepublicSloveniaSmall statesSolomon IslandsSomaliaSouth AfricaSouth AsiaSouth Asia (IDA & IBRD)SpainSri LankaSt. Kitts and NevisSt. LuciaSt. Vincent and the GrenadinesSub-Saharan Africa Sub-Saharan Africa (excluding high income)Sub-Saharan Africa (IDA & IBRD countries)SudanSurinameSwazilandSwedenSwitzerlandSyrian Arab RepublicTajikistanTanzaniaThailandTimor-LesteTogoTongaTrinidad and TobagoTunisiaTurkeyTurkmenistanTuvaluUgandaUkraineUnited KingdomUnited StatesUpper middle incomeUruguayUzbekistanVanuatuVenezuela, RBVietnamWest Bank and GazaWorldYemen, Rep.ZambiaZimbabwe Timeline:
This timeline shows a graph from 1971 to 2016 of Norway. No data until 1970. Number of actual observations by date: 46.
Source name:
World Development Indicators
Source organization:
World Bank national accounts data, and OECD National Accounts data files.
Categories, topics:
Agriculture & Rural Development, Economy & Growth, Climate Change
Last updated:
apr 23, 2017
Indicators value changes by year
At the date of observation
Value
Absolute change
Change from previous value
jan 1, 1971
5.845
+5.845
0.0%
jan 1, 1972
5.881
+0.036
0.62%
jan 1, 1973
5.301
-0.58
-9.86%
jan 1, 1974
5.123
-0.178
-3.36%
jan 1, 1975
5.0
-0.123
-2.41%
jan 1, 1976
4.675
-0.325
-6.49%
jan 1, 1977
5.002
+0.327
7.0%
jan 1, 1978
5.046
+0.044
0.88%
jan 1, 1979
4.774
-0.272
-5.39%
jan 1, 1980
4.26
-0.514
-10.77%
jan 1, 1981
4.056
-0.204
-4.8%
jan 1, 1982
4.073
+0.017
0.42%
jan 1, 1983
3.838
-0.234
-5.76%
jan 1, 1984
3.332
-0.506
-13.19%
jan 1, 1985
3.449
+0.117
3.5%
jan 1, 1986
3.249
-0.199
-5.78%
jan 1, 1987
3.632
+0.383
11.79%
jan 1, 1988
3.685
+0.053
1.45%
jan 1, 1989
3.524
-0.161
-4.37%
jan 1, 1990
3.279
-0.245
-6.94%
jan 1, 1991
3.358
+0.078
2.38%
jan 1, 1992
3.281
-0.077
-2.29%
jan 1, 1993
2.974
-0.307
-9.35%
jan 1, 1994
2.97
-0.004
-0.14%
jan 1, 1995
2.986
+0.016
0.53%
jan 1, 1996
2.986
+0.001
0.02%
jan 1, 1997
2.567
-0.419
-14.04%
jan 1, 1998
2.377
-0.19
-7.41%
jan 1, 1999
2.62
+0.243
10.23%
jan 1, 2000
2.365
-0.255
-9.75%
jan 1, 2001
2.067
-0.298
-12.59%
jan 1, 2002
1.798
-0.269
-12.99%
jan 1, 2003
1.725
-0.074
-4.11%
jan 1, 2004
1.477
-0.248
-14.36%
jan 1, 2005
1.562
+0.085
5.79%
jan 1, 2006
1.574
+0.012
0.74%
jan 1, 2007
1.575
+0.001
0.07%
jan 1, 2008
1.398
-0.177
-11.27%
jan 1, 2009
1.254
-0.143
-10.25%
jan 1, 2010
1.456
+0.202
16.11%
jan 1, 2011
1.762
+0.306
21.03%
jan 1, 2012
1.504
-0.259
-14.67%
jan 1, 2013
1.258
-0.246
-16.33%
jan 1, 2014
1.469
+0.211
16.77%
jan 1, 2015
1.614
+0.144
9.83%
jan 1, 2016
1.813
+0.199
12.35%
Ranking of countries by current statistics by years


Comments: