29
/
en
AIzaSyAYiBZKx7MnpbEhh9jyipgxe19OcubqV5w
April 1, 2024
103265
Chad
TCD
true
2
1
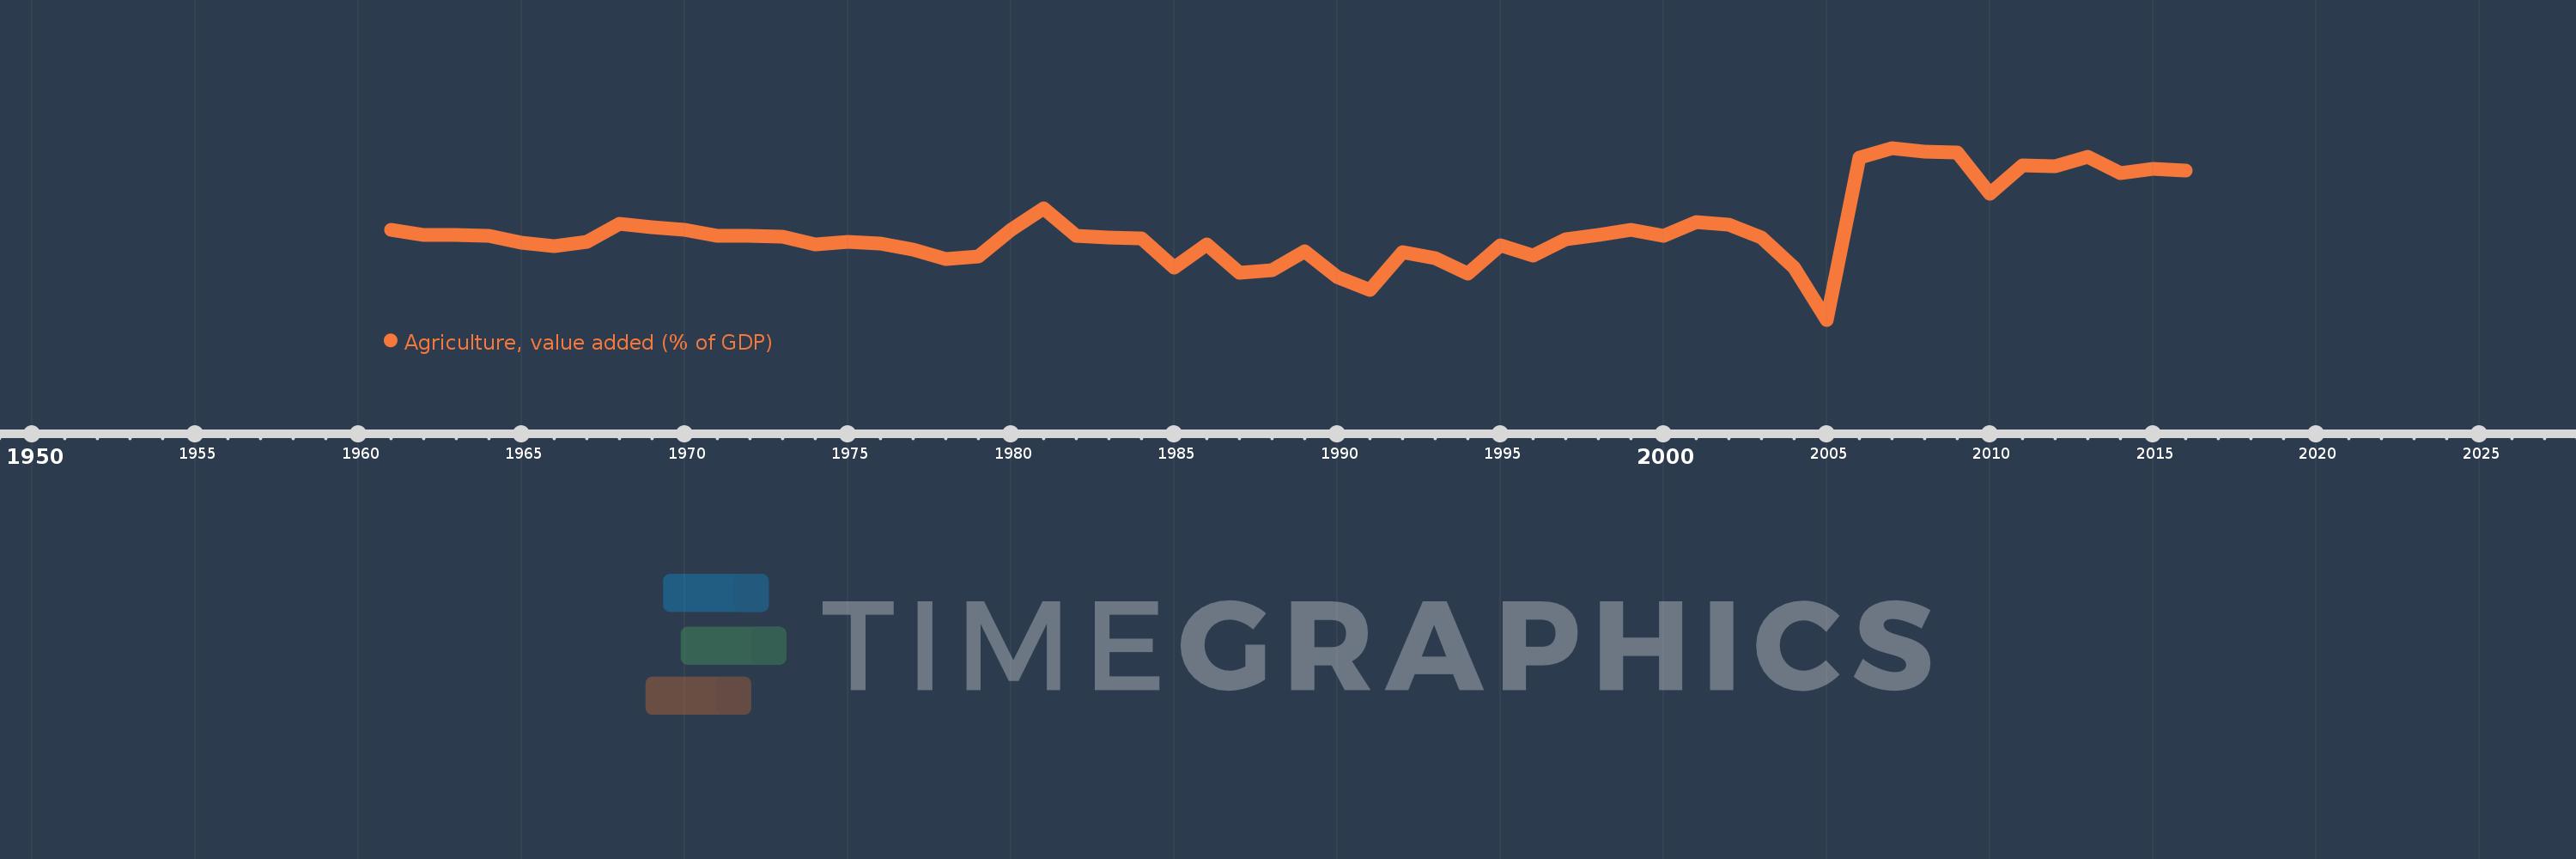
Agriculture, value added (% of GDP)
2016,2015,2014,2013,2012,2011,2010,2009,2008,2007,2006,2005,2004,2003,2002,2001,2000,1999,1998,1997,1996,1995,1994,1993,1992,1991,1990,1989,1988,1987,1986,1985,1984,1983,1982,1981,1980,1979,1978,1977,1976,1975,1974,1973,1972,1971,1970,1969,1968,1967,1966,1965,1964,1963,1962,1961
This statistics in other country:
AfghanistanAlbaniaAlgeriaAndorraAngolaAntigua and BarbudaArab WorldArgentinaArmeniaArubaAustraliaAustriaAzerbaijanBahamas, TheBahrainBangladeshBarbadosBelarusBelgiumBelizeBeninBermudaBhutanBoliviaBosnia and HerzegovinaBotswanaBrazilBrunei DarussalamBulgariaBurkina FasoBurundiCabo VerdeCambodiaCameroonCanadaCaribbean small statesCayman IslandsCentral African RepublicCentral Europe and the BalticsChadChileChinaColombiaComorosCongo, Dem. Rep.Congo, Rep.Costa RicaCote d'IvoireCroatiaCubaCyprusCzech RepublicDenmarkDjiboutiDominicaDominican RepublicEarly-demographic dividendEast Asia & PacificEast Asia & Pacific (excluding high income)East Asia & Pacific (IDA & IBRD countries)EcuadorEgypt, Arab Rep.El SalvadorEquatorial GuineaEritreaEstoniaEthiopiaEuro areaEurope & Central AsiaEurope & Central Asia (excluding high income)Europe & Central Asia (IDA & IBRD countries)European UnionFijiFinlandFragile and conflict affected situationsFranceFrench PolynesiaGabonGambia, TheGeorgiaGermanyGhanaGreeceGrenadaGuatemalaGuineaGuinea-BissauGuyanaHeavily indebted poor countries (HIPC)High incomeHondurasHong Kong SAR, ChinaHungaryIBRD onlyIcelandIDA & IBRD totalIDA blendIDA onlyIDA totalIndiaIndonesiaIran, Islamic Rep.IrelandItalyJamaicaJapanJordanKazakhstanKenyaKiribatiKorea, Rep.KosovoKuwaitKyrgyz RepublicLao PDRLate-demographic dividendLatin America & Caribbean Latin America & Caribbean (excluding high income)Latin America & the Caribbean (IDA & IBRD countries)LatviaLeast developed countries: UN classificationLebanonLesothoLibyaLithuaniaLow & middle incomeLow incomeLower middle incomeLuxembourgMacao SAR, ChinaMacedonia, FYRMadagascarMalawiMalaysiaMaldivesMaliMaltaMarshall IslandsMauritaniaMauritiusMexicoMicronesia, Fed. Sts.Middle East & North AfricaMiddle East & North Africa (excluding high income)Middle East & North Africa (IDA & IBRD countries)Middle incomeMoldovaMongoliaMontenegroMoroccoMozambiqueMyanmarNamibiaNepalNetherlandsNew CaledoniaNew ZealandNicaraguaNigerNigeriaNorth AmericaNorwayOECD membersOmanOther small statesPacific island small statesPakistanPalauPanamaPapua New GuineaParaguayPeruPhilippinesPolandPortugalPost-demographic dividendPre-demographic dividendPuerto RicoQatarRomaniaRussian FederationRwandaSao Tome and PrincipeSaudi ArabiaSenegalSerbiaSeychellesSierra LeoneSingaporeSlovak RepublicSloveniaSmall statesSolomon IslandsSomaliaSouth AfricaSouth AsiaSouth Asia (IDA & IBRD)SpainSri LankaSt. Kitts and NevisSt. LuciaSt. Vincent and the GrenadinesSub-Saharan Africa Sub-Saharan Africa (excluding high income)Sub-Saharan Africa (IDA & IBRD countries)SudanSurinameSwazilandSwedenSwitzerlandSyrian Arab RepublicTajikistanTanzaniaThailandTimor-LesteTogoTongaTrinidad and TobagoTunisiaTurkeyTurkmenistanTuvaluUgandaUkraineUnited KingdomUnited StatesUpper middle incomeUruguayUzbekistanVanuatuVenezuela, RBVietnamWest Bank and GazaWorldYemen, Rep.ZambiaZimbabwe Timeline:
This timeline shows a graph from 1961 to 2016 of Chad. No data until 1960. Number of actual observations by date: 56.
Source name:
World Development Indicators
Source organization:
World Bank national accounts data, and OECD National Accounts data files.
Categories, topics:
Agriculture & Rural Development, Economy & Growth, Climate Change
Last updated:
apr 23, 2017
Indicators value changes by year
Maximum:
56.718
jan 1, 2007
At the date of observation
Value
Absolute change
Change from previous value
jan 1, 1961
40.927
+40.927
0.0%
jan 1, 1962
39.868
-1.058
-2.59%
jan 1, 1963
39.812
-0.056
-0.14%
jan 1, 1964
39.726
-0.086
-0.22%
jan 1, 1965
38.462
-1.264
-3.18%
jan 1, 1966
37.745
-0.717
-1.86%
jan 1, 1967
38.499
+0.754
2.0%
jan 1, 1968
42.08
+3.582
9.3%
jan 1, 1969
41.354
-0.726
-1.73%
jan 1, 1970
40.851
-0.503
-1.22%
jan 1, 1971
39.679
-1.172
-2.87%
jan 1, 1972
39.675
-0.004
-0.01%
jan 1, 1973
39.523
-0.152
-0.38%
jan 1, 1974
38.02
-1.502
-3.8%
jan 1, 1975
38.543
+0.523
1.37%
jan 1, 1976
38.29
-0.253
-0.66%
jan 1, 1977
37.016
-1.274
-3.33%
jan 1, 1978
35.166
-1.85
-5.0%
jan 1, 1979
35.766
+0.6
1.71%
jan 1, 1980
40.814
+5.048
14.11%
jan 1, 1981
45.089
+4.275
10.47%
jan 1, 1982
39.75
-5.339
-11.84%
jan 1, 1983
39.457
-0.293
-0.74%
jan 1, 1984
39.157
-0.3
-0.76%
jan 1, 1985
33.613
-5.544
-14.16%
jan 1, 1986
38.059
+4.446
13.23%
jan 1, 1987
32.622
-5.437
-14.28%
jan 1, 1988
33.113
+0.491
1.51%
jan 1, 1989
36.758
+3.645
11.01%
jan 1, 1990
31.656
-5.103
-13.88%
jan 1, 1991
29.28
-2.376
-7.5%
jan 1, 1992
36.496
+7.216
24.65%
jan 1, 1993
35.343
-1.152
-3.16%
jan 1, 1994
32.465
-2.879
-8.14%
jan 1, 1995
37.836
+5.371
16.55%
jan 1, 1996
35.838
-1.998
-5.28%
jan 1, 1997
39.004
+3.166
8.83%
jan 1, 1998
39.944
+0.94
2.41%
jan 1, 1999
40.817
+0.873
2.19%
jan 1, 2000
39.747
-1.07
-2.62%
jan 1, 2001
42.314
+2.567
6.46%
jan 1, 2002
41.81
-0.504
-1.19%
jan 1, 2003
39.443
-2.367
-5.66%
jan 1, 2004
33.597
-5.846
-14.82%
jan 1, 2005
23.47
-10.127
-30.14%
jan 1, 2006
54.845
+31.375
133.68%
jan 1, 2007
56.718
+1.874
3.42%
jan 1, 2008
56.002
-0.716
-1.26%
jan 1, 2009
55.917
-0.086
-0.15%
jan 1, 2010
47.855
-8.061
-14.42%
jan 1, 2011
53.373
+5.517
11.53%
jan 1, 2012
53.109
-0.264
-0.49%
jan 1, 2013
55.088
+1.979
3.73%
jan 1, 2014
51.917
-3.171
-5.76%
jan 1, 2015
52.621
+0.704
1.36%
jan 1, 2016
52.386
-0.235
-0.45%
Ranking of countries by current statistics by years


Comments: