29
/
en
AIzaSyAYiBZKx7MnpbEhh9jyipgxe19OcubqV5w
April 1, 2024
109304
Congo, Dem. Rep.
COD
true
2
1
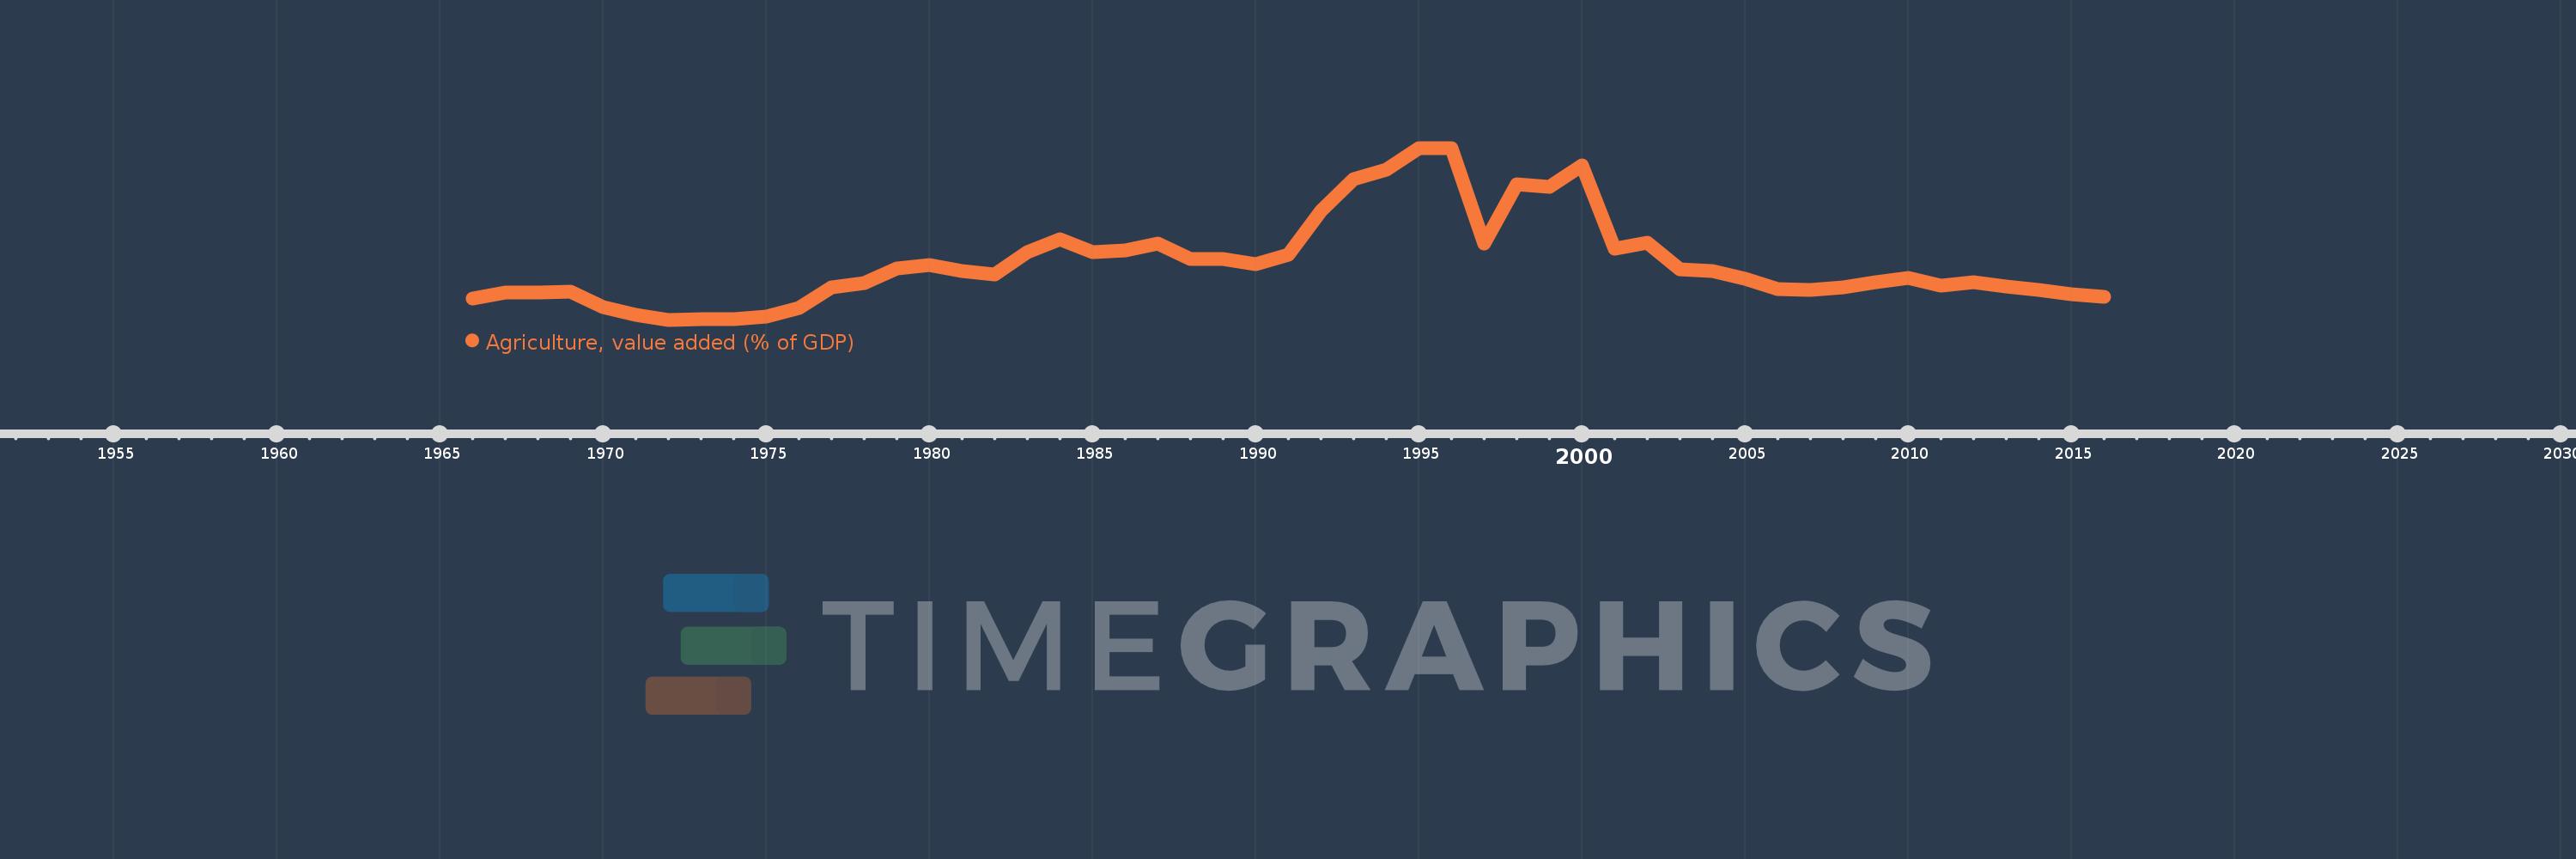
Agriculture, value added (% of GDP)
2016,2015,2014,2013,2012,2011,2010,2009,2008,2007,2006,2005,2004,2003,2002,2001,2000,1999,1998,1997,1996,1995,1994,1993,1992,1991,1990,1989,1988,1987,1986,1985,1984,1983,1982,1981,1980,1979,1978,1977,1976,1975,1974,1973,1972,1971,1970,1969,1968,1967,1966
This statistics in other country:
AfghanistanAlbaniaAlgeriaAndorraAngolaAntigua and BarbudaArab WorldArgentinaArmeniaArubaAustraliaAustriaAzerbaijanBahamas, TheBahrainBangladeshBarbadosBelarusBelgiumBelizeBeninBermudaBhutanBoliviaBosnia and HerzegovinaBotswanaBrazilBrunei DarussalamBulgariaBurkina FasoBurundiCabo VerdeCambodiaCameroonCanadaCaribbean small statesCayman IslandsCentral African RepublicCentral Europe and the BalticsChadChileChinaColombiaComorosCongo, Dem. Rep.Congo, Rep.Costa RicaCote d'IvoireCroatiaCubaCyprusCzech RepublicDenmarkDjiboutiDominicaDominican RepublicEarly-demographic dividendEast Asia & PacificEast Asia & Pacific (excluding high income)East Asia & Pacific (IDA & IBRD countries)EcuadorEgypt, Arab Rep.El SalvadorEquatorial GuineaEritreaEstoniaEthiopiaEuro areaEurope & Central AsiaEurope & Central Asia (excluding high income)Europe & Central Asia (IDA & IBRD countries)European UnionFijiFinlandFragile and conflict affected situationsFranceFrench PolynesiaGabonGambia, TheGeorgiaGermanyGhanaGreeceGrenadaGuatemalaGuineaGuinea-BissauGuyanaHeavily indebted poor countries (HIPC)High incomeHondurasHong Kong SAR, ChinaHungaryIBRD onlyIcelandIDA & IBRD totalIDA blendIDA onlyIDA totalIndiaIndonesiaIran, Islamic Rep.IrelandItalyJamaicaJapanJordanKazakhstanKenyaKiribatiKorea, Rep.KosovoKuwaitKyrgyz RepublicLao PDRLate-demographic dividendLatin America & Caribbean Latin America & Caribbean (excluding high income)Latin America & the Caribbean (IDA & IBRD countries)LatviaLeast developed countries: UN classificationLebanonLesothoLibyaLithuaniaLow & middle incomeLow incomeLower middle incomeLuxembourgMacao SAR, ChinaMacedonia, FYRMadagascarMalawiMalaysiaMaldivesMaliMaltaMarshall IslandsMauritaniaMauritiusMexicoMicronesia, Fed. Sts.Middle East & North AfricaMiddle East & North Africa (excluding high income)Middle East & North Africa (IDA & IBRD countries)Middle incomeMoldovaMongoliaMontenegroMoroccoMozambiqueMyanmarNamibiaNepalNetherlandsNew CaledoniaNew ZealandNicaraguaNigerNigeriaNorth AmericaNorwayOECD membersOmanOther small statesPacific island small statesPakistanPalauPanamaPapua New GuineaParaguayPeruPhilippinesPolandPortugalPost-demographic dividendPre-demographic dividendPuerto RicoQatarRomaniaRussian FederationRwandaSao Tome and PrincipeSaudi ArabiaSenegalSerbiaSeychellesSierra LeoneSingaporeSlovak RepublicSloveniaSmall statesSolomon IslandsSomaliaSouth AfricaSouth AsiaSouth Asia (IDA & IBRD)SpainSri LankaSt. Kitts and NevisSt. LuciaSt. Vincent and the GrenadinesSub-Saharan Africa Sub-Saharan Africa (excluding high income)Sub-Saharan Africa (IDA & IBRD countries)SudanSurinameSwazilandSwedenSwitzerlandSyrian Arab RepublicTajikistanTanzaniaThailandTimor-LesteTogoTongaTrinidad and TobagoTunisiaTurkeyTurkmenistanTuvaluUgandaUkraineUnited KingdomUnited StatesUpper middle incomeUruguayUzbekistanVanuatuVenezuela, RBVietnamWest Bank and GazaWorldYemen, Rep.ZambiaZimbabwe Timeline:
This timeline shows a graph from 1966 to 2016 of Congo, Dem. Rep.. No data until 1965. Number of actual observations by date: 51.
Source name:
World Development Indicators
Source organization:
World Bank national accounts data, and OECD National Accounts data files.
Categories, topics:
Agriculture & Rural Development, Economy & Growth, Climate Change
Last updated:
apr 23, 2017
Indicators value changes by year
Minimum:
14.939
jan 1, 1972
At the date of observation
Value
Absolute change
Change from previous value
jan 1, 1966
20.096
+20.096
0.0%
jan 1, 1967
21.633
+1.537
7.65%
jan 1, 1968
21.642
+0.009
0.04%
jan 1, 1969
21.781
+0.139
0.64%
jan 1, 1970
18.001
-3.78
-17.35%
jan 1, 1971
16.138
-1.863
-10.35%
jan 1, 1972
14.939
-1.199
-7.43%
jan 1, 1973
15.183
+0.244
1.63%
jan 1, 1974
15.044
-0.139
-0.91%
jan 1, 1975
15.76
+0.716
4.76%
jan 1, 1976
17.734
+1.974
12.53%
jan 1, 1977
22.879
+5.144
29.01%
jan 1, 1978
23.964
+1.086
4.75%
jan 1, 1979
27.498
+3.534
14.75%
jan 1, 1980
28.319
+0.82
2.98%
jan 1, 1981
26.822
-1.497
-5.29%
jan 1, 1982
25.931
-0.89
-3.32%
jan 1, 1983
31.447
+5.515
21.27%
jan 1, 1984
34.547
+3.1
9.86%
jan 1, 1985
31.439
-3.108
-9.0%
jan 1, 1986
31.822
+0.383
1.22%
jan 1, 1987
33.622
+1.801
5.66%
jan 1, 1988
29.727
-3.895
-11.58%
jan 1, 1989
29.839
+0.111
0.37%
jan 1, 1990
28.58
-1.259
-4.22%
jan 1, 1991
30.964
+2.385
8.34%
jan 1, 1992
41.67
+10.705
34.57%
jan 1, 1993
49.415
+7.746
18.59%
jan 1, 1994
51.723
+2.308
4.67%
jan 1, 1995
57.0
+5.277
10.2%
jan 1, 1997
33.552
-23.448
-41.14%
jan 1, 1998
48.137
+14.586
43.47%
jan 1, 1999
47.482
-0.655
-1.36%
jan 1, 2000
52.695
+5.214
10.98%
jan 1, 2001
32.331
-20.365
-38.65%
jan 1, 2002
33.737
+1.406
4.35%
jan 1, 2003
27.334
-6.403
-18.98%
jan 1, 2004
26.887
-0.447
-1.64%
jan 1, 2005
24.917
-1.97
-7.33%
jan 1, 2006
22.382
-2.535
-10.17%
jan 1, 2007
22.339
-0.044
-0.19%
jan 1, 2008
22.845
+0.507
2.27%
jan 1, 2009
24.169
+1.323
5.79%
jan 1, 2010
25.165
+0.996
4.12%
jan 1, 2011
23.338
-1.827
-7.26%
jan 1, 2012
24.041
+0.703
3.01%
jan 1, 2013
23.124
-0.917
-3.81%
jan 1, 2014
22.166
-0.959
-4.15%
jan 1, 2015
21.153
-1.013
-4.57%
jan 1, 2016
20.626
-0.527
-2.49%
Ranking of countries by current statistics by years


Comments: