29
/
en
AIzaSyAYiBZKx7MnpbEhh9jyipgxe19OcubqV5w
April 1, 2024
285503
Zambia
ZMB
true
2
1
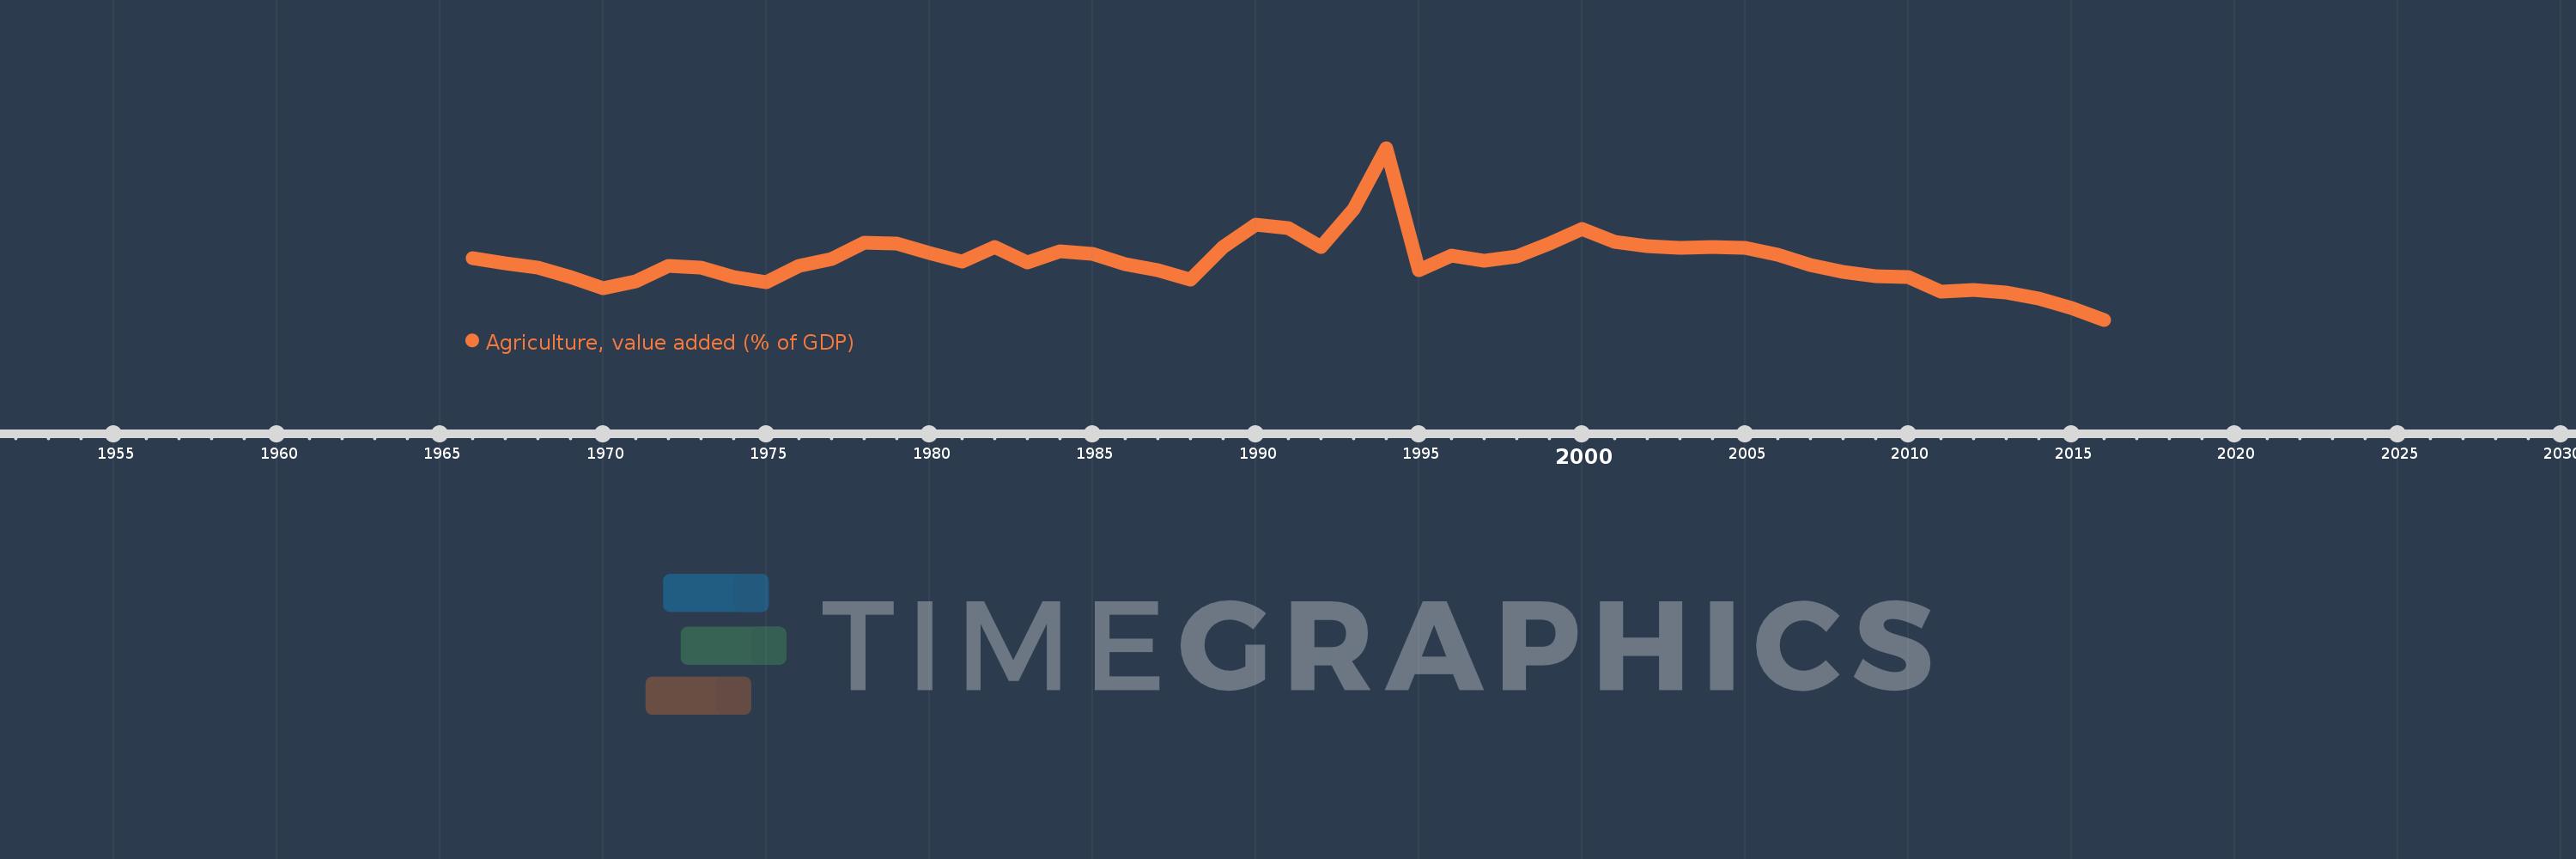
Agriculture, value added (% of GDP)
2016,2015,2014,2013,2012,2011,2010,2009,2008,2007,2006,2005,2004,2003,2002,2001,2000,1999,1998,1997,1996,1995,1994,1993,1992,1991,1990,1989,1988,1987,1986,1985,1984,1983,1982,1981,1980,1979,1978,1977,1976,1975,1974,1973,1972,1971,1970,1969,1968,1967,1966
This statistics in other country:
AfghanistanAlbaniaAlgeriaAndorraAngolaAntigua and BarbudaArab WorldArgentinaArmeniaArubaAustraliaAustriaAzerbaijanBahamas, TheBahrainBangladeshBarbadosBelarusBelgiumBelizeBeninBermudaBhutanBoliviaBosnia and HerzegovinaBotswanaBrazilBrunei DarussalamBulgariaBurkina FasoBurundiCabo VerdeCambodiaCameroonCanadaCaribbean small statesCayman IslandsCentral African RepublicCentral Europe and the BalticsChadChileChinaColombiaComorosCongo, Dem. Rep.Congo, Rep.Costa RicaCote d'IvoireCroatiaCubaCyprusCzech RepublicDenmarkDjiboutiDominicaDominican RepublicEarly-demographic dividendEast Asia & PacificEast Asia & Pacific (excluding high income)East Asia & Pacific (IDA & IBRD countries)EcuadorEgypt, Arab Rep.El SalvadorEquatorial GuineaEritreaEstoniaEthiopiaEuro areaEurope & Central AsiaEurope & Central Asia (excluding high income)Europe & Central Asia (IDA & IBRD countries)European UnionFijiFinlandFragile and conflict affected situationsFranceFrench PolynesiaGabonGambia, TheGeorgiaGermanyGhanaGreeceGrenadaGuatemalaGuineaGuinea-BissauGuyanaHeavily indebted poor countries (HIPC)High incomeHondurasHong Kong SAR, ChinaHungaryIBRD onlyIcelandIDA & IBRD totalIDA blendIDA onlyIDA totalIndiaIndonesiaIran, Islamic Rep.IrelandItalyJamaicaJapanJordanKazakhstanKenyaKiribatiKorea, Rep.KosovoKuwaitKyrgyz RepublicLao PDRLate-demographic dividendLatin America & Caribbean Latin America & Caribbean (excluding high income)Latin America & the Caribbean (IDA & IBRD countries)LatviaLeast developed countries: UN classificationLebanonLesothoLibyaLithuaniaLow & middle incomeLow incomeLower middle incomeLuxembourgMacao SAR, ChinaMacedonia, FYRMadagascarMalawiMalaysiaMaldivesMaliMaltaMarshall IslandsMauritaniaMauritiusMexicoMicronesia, Fed. Sts.Middle East & North AfricaMiddle East & North Africa (excluding high income)Middle East & North Africa (IDA & IBRD countries)Middle incomeMoldovaMongoliaMontenegroMoroccoMozambiqueMyanmarNamibiaNepalNetherlandsNew CaledoniaNew ZealandNicaraguaNigerNigeriaNorth AmericaNorwayOECD membersOmanOther small statesPacific island small statesPakistanPalauPanamaPapua New GuineaParaguayPeruPhilippinesPolandPortugalPost-demographic dividendPre-demographic dividendPuerto RicoQatarRomaniaRussian FederationRwandaSao Tome and PrincipeSaudi ArabiaSenegalSerbiaSeychellesSierra LeoneSingaporeSlovak RepublicSloveniaSmall statesSolomon IslandsSomaliaSouth AfricaSouth AsiaSouth Asia (IDA & IBRD)SpainSri LankaSt. Kitts and NevisSt. LuciaSt. Vincent and the GrenadinesSub-Saharan Africa Sub-Saharan Africa (excluding high income)Sub-Saharan Africa (IDA & IBRD countries)SudanSurinameSwazilandSwedenSwitzerlandSyrian Arab RepublicTajikistanTanzaniaThailandTimor-LesteTogoTongaTrinidad and TobagoTunisiaTurkeyTurkmenistanTuvaluUgandaUkraineUnited KingdomUnited StatesUpper middle incomeUruguayUzbekistanVanuatuVenezuela, RBVietnamWest Bank and GazaWorldYemen, Rep.ZambiaZimbabwe Timeline:
This timeline shows a graph from 1966 to 2016 of Zambia. No data until 1965. Number of actual observations by date: 51.
Source name:
World Development Indicators
Source organization:
World Bank national accounts data, and OECD National Accounts data files.
Categories, topics:
Agriculture & Rural Development, Economy & Growth, Climate Change
Last updated:
apr 23, 2017
Indicators value changes by year
Maximum:
34.102
jan 1, 1994
At the date of observation
Value
Absolute change
Change from previous value
jan 1, 1966
15.634
+15.634
0.0%
jan 1, 1967
14.691
-0.943
-6.03%
jan 1, 1968
14.025
-0.666
-4.54%
jan 1, 1969
12.439
-1.586
-11.31%
jan 1, 1970
10.556
-1.884
-15.14%
jan 1, 1971
11.632
+1.077
10.2%
jan 1, 1972
14.246
+2.614
22.47%
jan 1, 1973
14.057
-0.189
-1.33%
jan 1, 1974
12.352
-1.705
-12.13%
jan 1, 1975
11.627
-0.725
-5.87%
jan 1, 1976
14.315
+2.689
23.12%
jan 1, 1977
15.511
+1.196
8.35%
jan 1, 1978
18.123
+2.612
16.84%
jan 1, 1979
18.111
-0.012
-0.07%
jan 1, 1980
16.39
-1.721
-9.5%
jan 1, 1981
15.071
-1.319
-8.05%
jan 1, 1982
17.41
+2.339
15.52%
jan 1, 1983
14.892
-2.518
-14.46%
jan 1, 1984
16.728
+1.836
12.33%
jan 1, 1985
16.361
-0.367
-2.19%
jan 1, 1986
14.571
-1.791
-10.94%
jan 1, 1987
13.562
-1.009
-6.92%
jan 1, 1988
12.049
-1.513
-11.16%
jan 1, 1989
17.422
+5.373
44.59%
jan 1, 1990
21.245
+3.823
21.94%
jan 1, 1991
20.605
-0.64
-3.01%
jan 1, 1992
17.428
-3.177
-15.42%
jan 1, 1993
23.812
+6.385
36.63%
jan 1, 1994
34.102
+10.289
43.21%
jan 1, 1995
13.563
-20.539
-60.23%
jan 1, 1996
16.001
+2.438
17.98%
jan 1, 1997
15.104
-0.896
-5.6%
jan 1, 1998
15.919
+0.815
5.4%
jan 1, 1999
18.034
+2.115
13.29%
jan 1, 2000
20.551
+2.517
13.96%
jan 1, 2001
18.279
-2.272
-11.06%
jan 1, 2002
17.647
-0.631
-3.45%
jan 1, 2003
17.268
-0.38
-2.15%
jan 1, 2004
17.455
+0.187
1.08%
jan 1, 2005
17.295
-0.159
-0.91%
jan 1, 2006
16.139
-1.157
-6.69%
jan 1, 2007
14.494
-1.645
-10.19%
jan 1, 2008
13.235
-1.259
-8.69%
jan 1, 2009
12.522
-0.713
-5.39%
jan 1, 2010
12.378
-0.143
-1.14%
jan 1, 2011
9.973
-2.405
-19.43%
jan 1, 2012
10.212
+0.239
2.39%
jan 1, 2013
9.861
-0.35
-3.43%
jan 1, 2014
8.759
-1.102
-11.18%
jan 1, 2015
7.271
-1.488
-16.98%
jan 1, 2016
5.251
-2.021
-27.79%
Ranking of countries by current statistics by years


Comments: