29
/
en
AIzaSyAYiBZKx7MnpbEhh9jyipgxe19OcubqV5w
April 1, 2024
44049
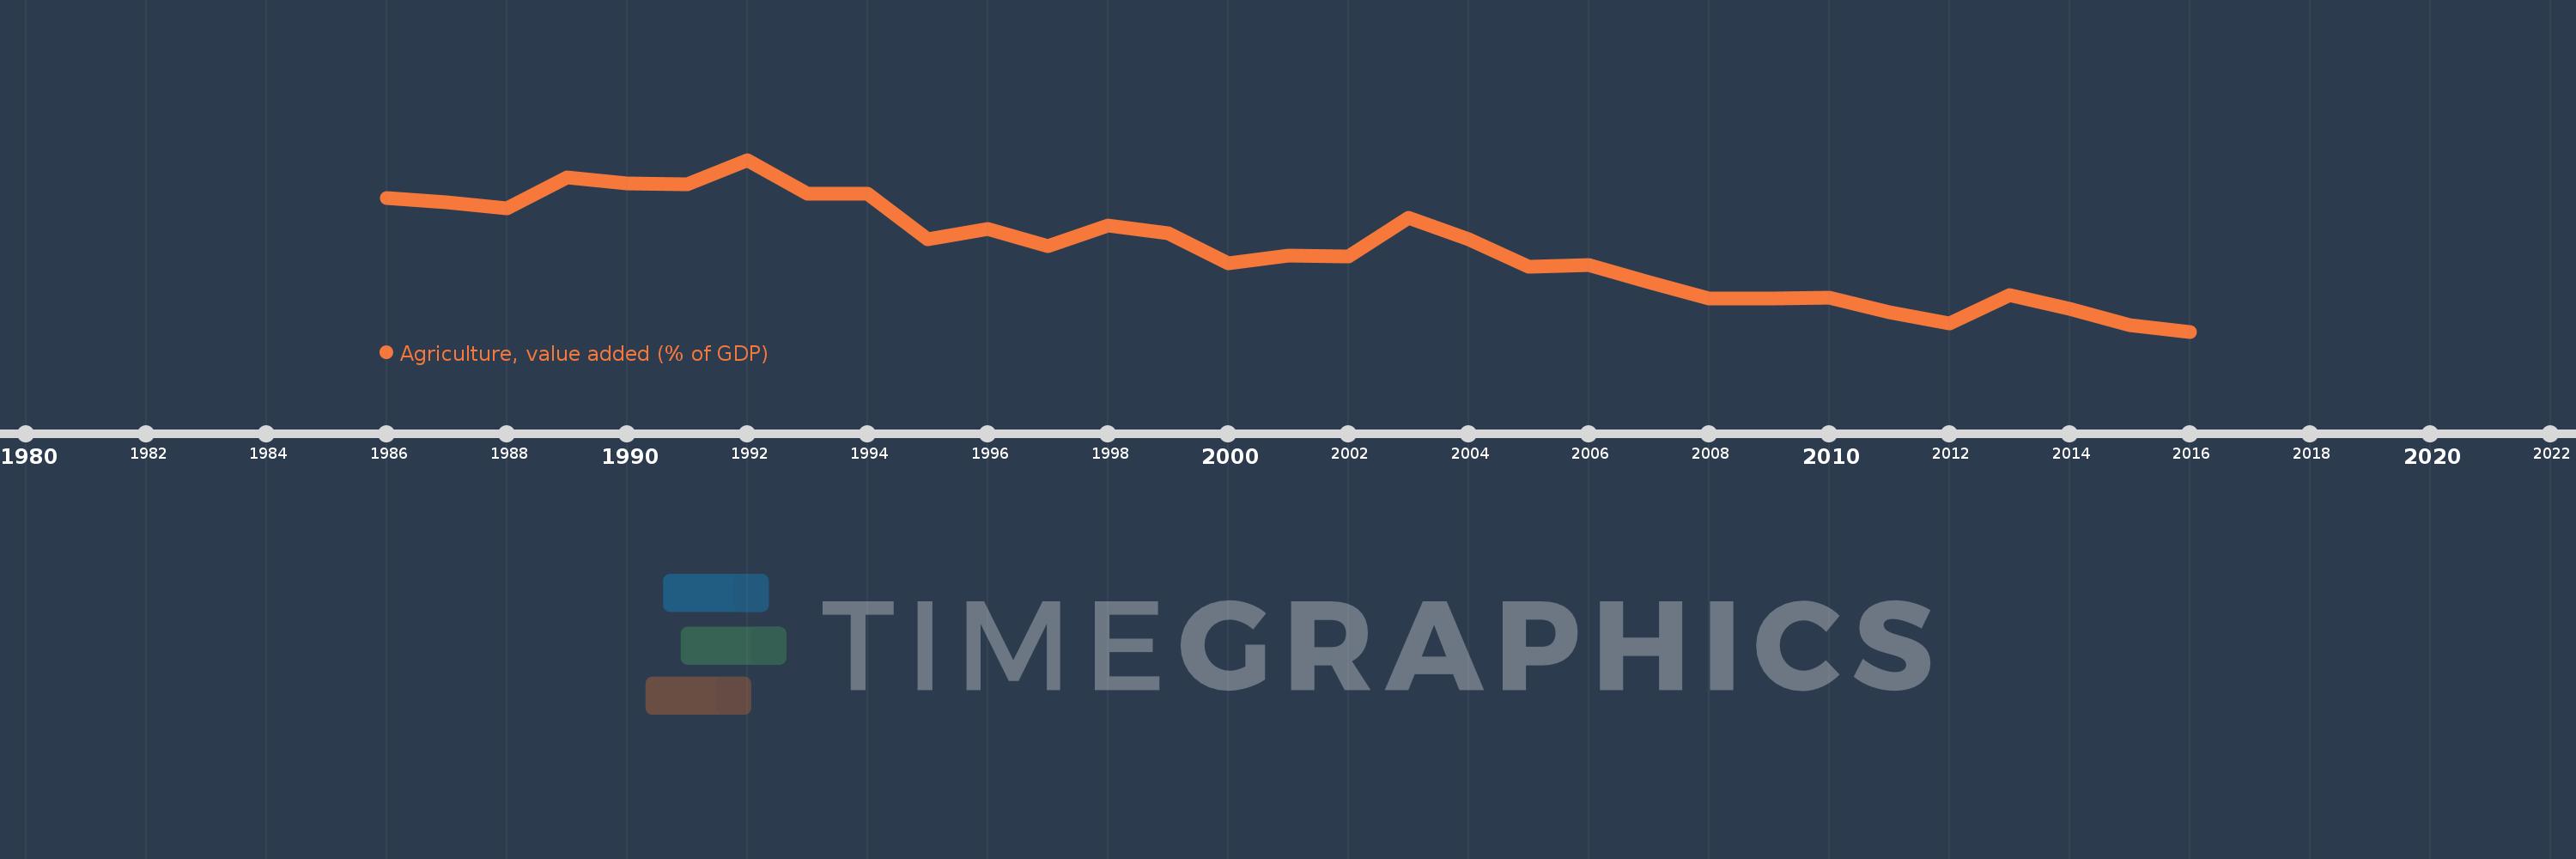
Least developed countries: UN classification
LDC
false
2
1
Agriculture, value added (% of GDP)
2016,2015,2014,2013,2012,2011,2010,2009,2008,2007,2006,2005,2004,2003,2002,2001,2000,1999,1998,1997,1996,1995,1994,1993,1992,1991,1990,1989,1988,1987,1986
This statistics in other country:
AfghanistanAlbaniaAlgeriaAndorraAngolaAntigua and BarbudaArab WorldArgentinaArmeniaArubaAustraliaAustriaAzerbaijanBahamas, TheBahrainBangladeshBarbadosBelarusBelgiumBelizeBeninBermudaBhutanBoliviaBosnia and HerzegovinaBotswanaBrazilBrunei DarussalamBulgariaBurkina FasoBurundiCabo VerdeCambodiaCameroonCanadaCaribbean small statesCayman IslandsCentral African RepublicCentral Europe and the BalticsChadChileChinaColombiaComorosCongo, Dem. Rep.Congo, Rep.Costa RicaCote d'IvoireCroatiaCubaCyprusCzech RepublicDenmarkDjiboutiDominicaDominican RepublicEarly-demographic dividendEast Asia & PacificEast Asia & Pacific (excluding high income)East Asia & Pacific (IDA & IBRD countries)EcuadorEgypt, Arab Rep.El SalvadorEquatorial GuineaEritreaEstoniaEthiopiaEuro areaEurope & Central AsiaEurope & Central Asia (excluding high income)Europe & Central Asia (IDA & IBRD countries)European UnionFijiFinlandFragile and conflict affected situationsFranceFrench PolynesiaGabonGambia, TheGeorgiaGermanyGhanaGreeceGrenadaGuatemalaGuineaGuinea-BissauGuyanaHeavily indebted poor countries (HIPC)High incomeHondurasHong Kong SAR, ChinaHungaryIBRD onlyIcelandIDA & IBRD totalIDA blendIDA onlyIDA totalIndiaIndonesiaIran, Islamic Rep.IrelandItalyJamaicaJapanJordanKazakhstanKenyaKiribatiKorea, Rep.KosovoKuwaitKyrgyz RepublicLao PDRLate-demographic dividendLatin America & Caribbean Latin America & Caribbean (excluding high income)Latin America & the Caribbean (IDA & IBRD countries)LatviaLeast developed countries: UN classificationLebanonLesothoLibyaLithuaniaLow & middle incomeLow incomeLower middle incomeLuxembourgMacao SAR, ChinaMacedonia, FYRMadagascarMalawiMalaysiaMaldivesMaliMaltaMarshall IslandsMauritaniaMauritiusMexicoMicronesia, Fed. Sts.Middle East & North AfricaMiddle East & North Africa (excluding high income)Middle East & North Africa (IDA & IBRD countries)Middle incomeMoldovaMongoliaMontenegroMoroccoMozambiqueMyanmarNamibiaNepalNetherlandsNew CaledoniaNew ZealandNicaraguaNigerNigeriaNorth AmericaNorwayOECD membersOmanOther small statesPacific island small statesPakistanPalauPanamaPapua New GuineaParaguayPeruPhilippinesPolandPortugalPost-demographic dividendPre-demographic dividendPuerto RicoQatarRomaniaRussian FederationRwandaSao Tome and PrincipeSaudi ArabiaSenegalSerbiaSeychellesSierra LeoneSingaporeSlovak RepublicSloveniaSmall statesSolomon IslandsSomaliaSouth AfricaSouth AsiaSouth Asia (IDA & IBRD)SpainSri LankaSt. Kitts and NevisSt. LuciaSt. Vincent and the GrenadinesSub-Saharan Africa Sub-Saharan Africa (excluding high income)Sub-Saharan Africa (IDA & IBRD countries)SudanSurinameSwazilandSwedenSwitzerlandSyrian Arab RepublicTajikistanTanzaniaThailandTimor-LesteTogoTongaTrinidad and TobagoTunisiaTurkeyTurkmenistanTuvaluUgandaUkraineUnited KingdomUnited StatesUpper middle incomeUruguayUzbekistanVanuatuVenezuela, RBVietnamWest Bank and GazaWorldYemen, Rep.ZambiaZimbabwe Timeline:
This timeline shows a graph from 1986 to 2016 of Least developed countries: UN classification. No data until 1985. Number of actual observations by date: 31.
Source name:
World Development Indicators
Source organization:
World Bank national accounts data, and OECD National Accounts data files.
Categories, topics:
Agriculture & Rural Development, Economy & Growth, Climate Change
Last updated:
apr 23, 2017
Indicators value changes by year
Minimum:
25.529
jan 1, 2016
Maximum:
35.341
jan 1, 1992
At the date of observation
Value
Absolute change
Change from previous value
jan 1, 1986
33.167
+33.167
0.0%
jan 1, 1987
32.9
-0.267
-0.8%
jan 1, 1988
32.571
-0.33
-1.0%
jan 1, 1989
34.349
+1.778
5.46%
jan 1, 1990
33.977
-0.371
-1.08%
jan 1, 1991
33.96
-0.018
-0.05%
jan 1, 1992
35.341
+1.382
4.07%
jan 1, 1993
33.39
-1.952
-5.52%
jan 1, 1994
33.381
-0.009
-0.03%
jan 1, 1995
30.825
-2.556
-7.66%
jan 1, 1996
31.386
+0.561
1.82%
jan 1, 1997
30.422
-0.964
-3.07%
jan 1, 1998
31.566
+1.144
3.76%
jan 1, 1999
31.161
-0.405
-1.28%
jan 1, 2000
29.424
-1.737
-5.57%
jan 1, 2001
29.862
+0.438
1.49%
jan 1, 2002
29.826
-0.036
-0.12%
jan 1, 2003
32.03
+2.205
7.39%
jan 1, 2004
30.788
-1.242
-3.88%
jan 1, 2005
29.227
-1.561
-5.07%
jan 1, 2006
29.332
+0.105
0.36%
jan 1, 2007
28.34
-0.992
-3.38%
jan 1, 2008
27.422
-0.918
-3.24%
jan 1, 2009
27.403
-0.019
-0.07%
jan 1, 2010
27.451
+0.048
0.17%
jan 1, 2011
26.631
-0.82
-2.99%
jan 1, 2012
26.019
-0.612
-2.3%
jan 1, 2013
27.637
+1.619
6.22%
jan 1, 2014
26.806
-0.831
-3.01%
jan 1, 2015
25.888
-0.918
-3.43%
jan 1, 2016
25.529
-0.359
-1.39%
Ranking of countries by current statistics by years


Comments: