29
/
en
AIzaSyAYiBZKx7MnpbEhh9jyipgxe19OcubqV5w
April 1, 2024
58711
Sub-Saharan Africa
SSF
false
2
1
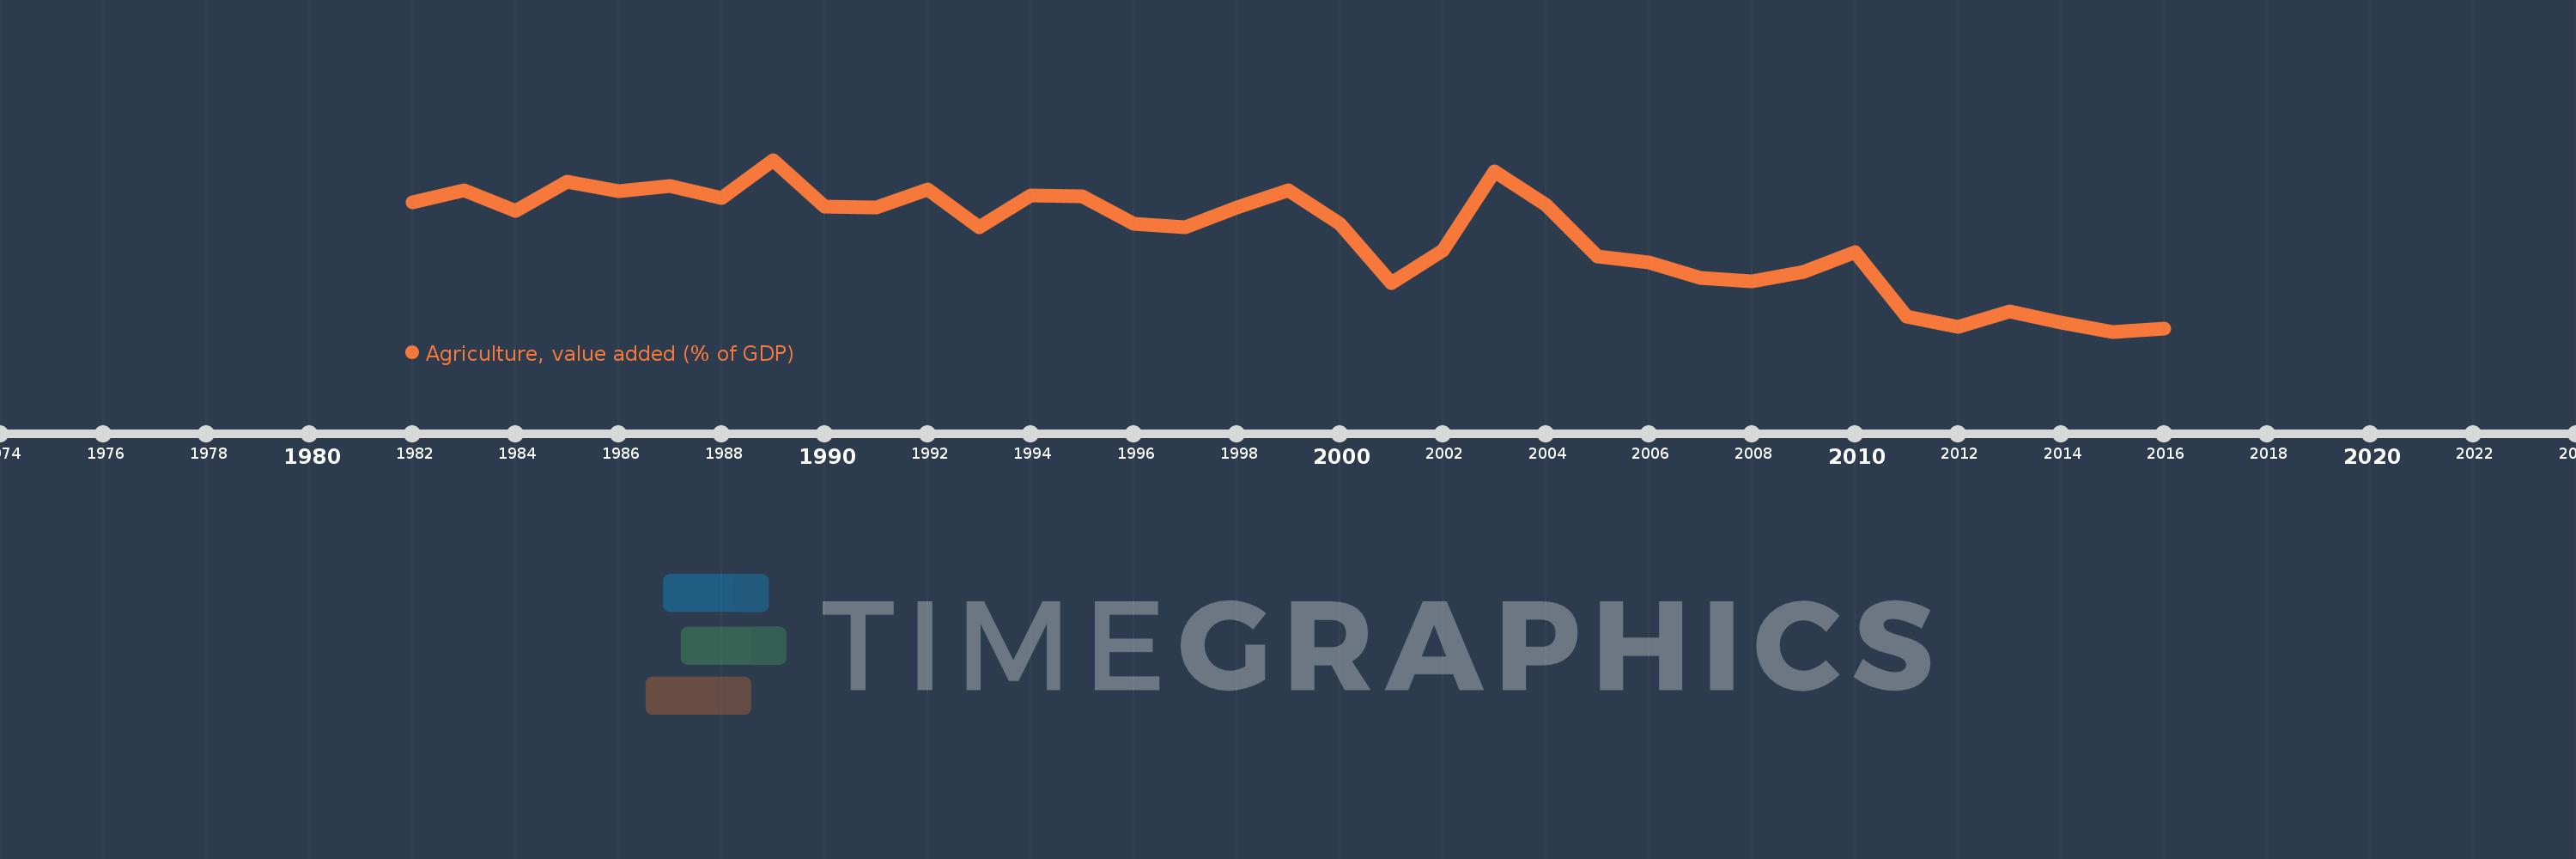
Agriculture, value added (% of GDP)
2016,2015,2014,2013,2012,2011,2010,2009,2008,2007,2006,2005,2004,2003,2002,2001,2000,1999,1998,1997,1996,1995,1994,1993,1992,1991,1990,1989,1988,1987,1986,1985,1984,1983,1982
This statistics in other country:
AfghanistanAlbaniaAlgeriaAndorraAngolaAntigua and BarbudaArab WorldArgentinaArmeniaArubaAustraliaAustriaAzerbaijanBahamas, TheBahrainBangladeshBarbadosBelarusBelgiumBelizeBeninBermudaBhutanBoliviaBosnia and HerzegovinaBotswanaBrazilBrunei DarussalamBulgariaBurkina FasoBurundiCabo VerdeCambodiaCameroonCanadaCaribbean small statesCayman IslandsCentral African RepublicCentral Europe and the BalticsChadChileChinaColombiaComorosCongo, Dem. Rep.Congo, Rep.Costa RicaCote d'IvoireCroatiaCubaCyprusCzech RepublicDenmarkDjiboutiDominicaDominican RepublicEarly-demographic dividendEast Asia & PacificEast Asia & Pacific (excluding high income)East Asia & Pacific (IDA & IBRD countries)EcuadorEgypt, Arab Rep.El SalvadorEquatorial GuineaEritreaEstoniaEthiopiaEuro areaEurope & Central AsiaEurope & Central Asia (excluding high income)Europe & Central Asia (IDA & IBRD countries)European UnionFijiFinlandFragile and conflict affected situationsFranceFrench PolynesiaGabonGambia, TheGeorgiaGermanyGhanaGreeceGrenadaGuatemalaGuineaGuinea-BissauGuyanaHeavily indebted poor countries (HIPC)High incomeHondurasHong Kong SAR, ChinaHungaryIBRD onlyIcelandIDA & IBRD totalIDA blendIDA onlyIDA totalIndiaIndonesiaIran, Islamic Rep.IrelandItalyJamaicaJapanJordanKazakhstanKenyaKiribatiKorea, Rep.KosovoKuwaitKyrgyz RepublicLao PDRLate-demographic dividendLatin America & Caribbean Latin America & Caribbean (excluding high income)Latin America & the Caribbean (IDA & IBRD countries)LatviaLeast developed countries: UN classificationLebanonLesothoLibyaLithuaniaLow & middle incomeLow incomeLower middle incomeLuxembourgMacao SAR, ChinaMacedonia, FYRMadagascarMalawiMalaysiaMaldivesMaliMaltaMarshall IslandsMauritaniaMauritiusMexicoMicronesia, Fed. Sts.Middle East & North AfricaMiddle East & North Africa (excluding high income)Middle East & North Africa (IDA & IBRD countries)Middle incomeMoldovaMongoliaMontenegroMoroccoMozambiqueMyanmarNamibiaNepalNetherlandsNew CaledoniaNew ZealandNicaraguaNigerNigeriaNorth AmericaNorwayOECD membersOmanOther small statesPacific island small statesPakistanPalauPanamaPapua New GuineaParaguayPeruPhilippinesPolandPortugalPost-demographic dividendPre-demographic dividendPuerto RicoQatarRomaniaRussian FederationRwandaSao Tome and PrincipeSaudi ArabiaSenegalSerbiaSeychellesSierra LeoneSingaporeSlovak RepublicSloveniaSmall statesSolomon IslandsSomaliaSouth AfricaSouth AsiaSouth Asia (IDA & IBRD)SpainSri LankaSt. Kitts and NevisSt. LuciaSt. Vincent and the GrenadinesSub-Saharan Africa Sub-Saharan Africa (excluding high income)Sub-Saharan Africa (IDA & IBRD countries)SudanSurinameSwazilandSwedenSwitzerlandSyrian Arab RepublicTajikistanTanzaniaThailandTimor-LesteTogoTongaTrinidad and TobagoTunisiaTurkeyTurkmenistanTuvaluUgandaUkraineUnited KingdomUnited StatesUpper middle incomeUruguayUzbekistanVanuatuVenezuela, RBVietnamWest Bank and GazaWorldYemen, Rep.ZambiaZimbabwe Timeline:
This timeline shows a graph from 1982 to 2016 of Sub-Saharan Africa . No data until 1981. Number of actual observations by date: 35.
Source name:
World Development Indicators
Source organization:
World Bank national accounts data, and OECD National Accounts data files.
Categories, topics:
Agriculture & Rural Development, Economy & Growth, Climate Change
Last updated:
apr 23, 2017
Indicators value changes by year
Maximum:
26.158
jan 1, 1989
At the date of observation
Value
Absolute change
Change from previous value
jan 1, 1982
23.979
+23.979
0.0%
jan 1, 1983
24.576
+0.598
2.49%
jan 1, 1984
23.54
-1.036
-4.22%
jan 1, 1985
25.013
+1.472
6.25%
jan 1, 1986
24.571
-0.442
-1.77%
jan 1, 1987
24.834
+0.263
1.07%
jan 1, 1988
24.219
-0.615
-2.48%
jan 1, 1989
26.158
+1.939
8.01%
jan 1, 1990
23.737
-2.422
-9.26%
jan 1, 1991
23.727
-0.01
-0.04%
jan 1, 1992
24.643
+0.917
3.86%
jan 1, 1993
22.708
-1.935
-7.85%
jan 1, 1994
24.311
+1.603
7.06%
jan 1, 1995
24.305
-0.006
-0.03%
jan 1, 1996
22.887
-1.417
-5.83%
jan 1, 1997
22.697
-0.191
-0.83%
jan 1, 1998
23.723
+1.026
4.52%
jan 1, 1999
24.596
+0.873
3.68%
jan 1, 2000
22.875
-1.721
-7.0%
jan 1, 2001
19.847
-3.028
-13.24%
jan 1, 2002
21.505
+1.658
8.36%
jan 1, 2003
25.547
+4.042
18.79%
jan 1, 2004
23.847
-1.7
-6.65%
jan 1, 2005
21.207
-2.64
-11.07%
jan 1, 2006
20.917
-0.289
-1.36%
jan 1, 2007
20.093
-0.824
-3.94%
jan 1, 2008
19.944
-0.15
-0.74%
jan 1, 2009
20.406
+0.462
2.32%
jan 1, 2010
21.434
+1.028
5.04%
jan 1, 2011
18.1
-3.334
-15.55%
jan 1, 2012
17.578
-0.522
-2.89%
jan 1, 2013
18.365
+0.787
4.48%
jan 1, 2014
17.813
-0.552
-3.01%
jan 1, 2015
17.35
-0.463
-2.6%
jan 1, 2016
17.502
+0.151
0.87%
Ranking of countries by current statistics by years


Comments: