29
/
en
AIzaSyAYiBZKx7MnpbEhh9jyipgxe19OcubqV5w
April 1, 2024
156968
Iran, Islamic Rep.
IRN
true
2
1
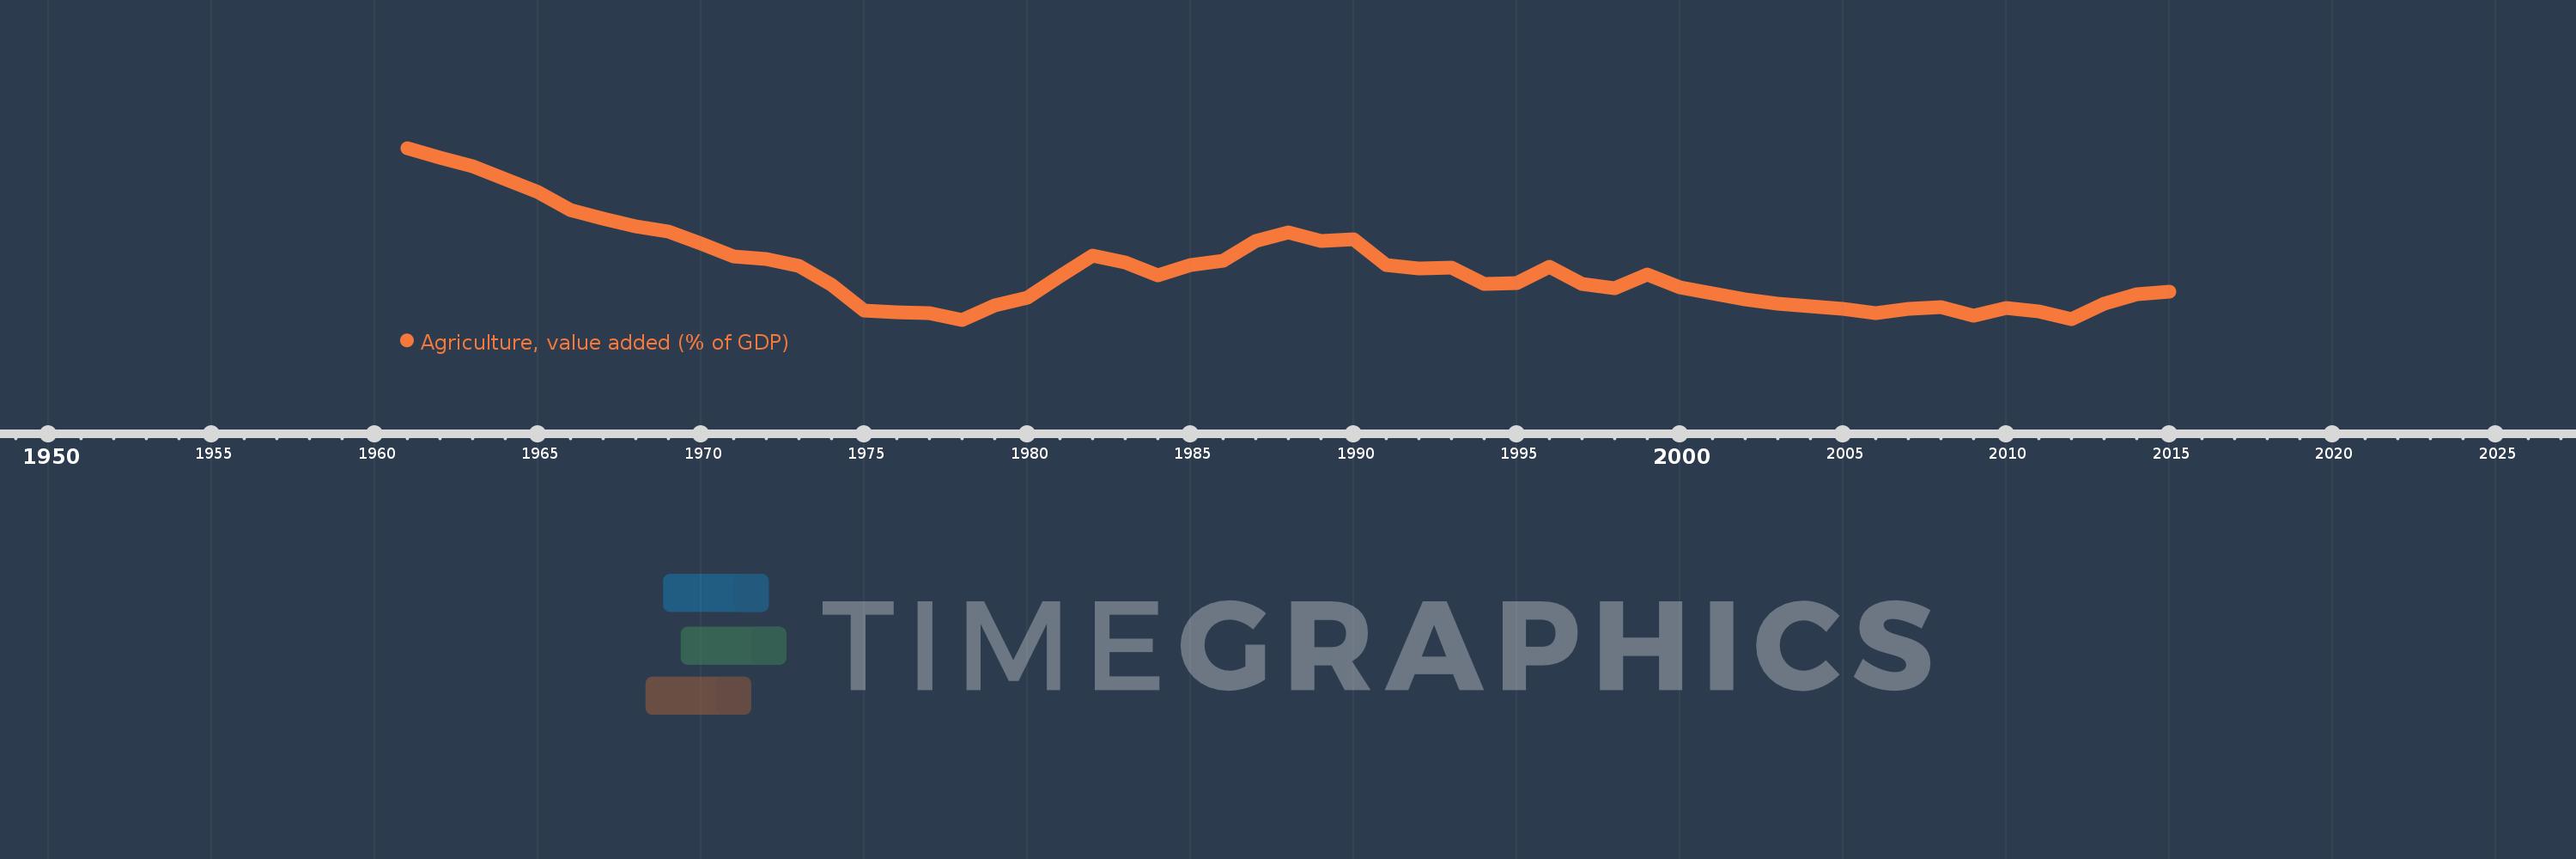
Agriculture, value added (% of GDP)
2015,2014,2013,2012,2011,2010,2009,2008,2007,2006,2005,2004,2003,2002,2001,2000,1999,1998,1997,1996,1995,1994,1993,1992,1991,1990,1989,1988,1987,1986,1985,1984,1983,1982,1981,1980,1979,1978,1977,1976,1975,1974,1973,1972,1971,1970,1969,1968,1967,1966,1965,1964,1963,1962,1961
This statistics in other country:
AfghanistanAlbaniaAlgeriaAndorraAngolaAntigua and BarbudaArab WorldArgentinaArmeniaArubaAustraliaAustriaAzerbaijanBahamas, TheBahrainBangladeshBarbadosBelarusBelgiumBelizeBeninBermudaBhutanBoliviaBosnia and HerzegovinaBotswanaBrazilBrunei DarussalamBulgariaBurkina FasoBurundiCabo VerdeCambodiaCameroonCanadaCaribbean small statesCayman IslandsCentral African RepublicCentral Europe and the BalticsChadChileChinaColombiaComorosCongo, Dem. Rep.Congo, Rep.Costa RicaCote d'IvoireCroatiaCubaCyprusCzech RepublicDenmarkDjiboutiDominicaDominican RepublicEarly-demographic dividendEast Asia & PacificEast Asia & Pacific (excluding high income)East Asia & Pacific (IDA & IBRD countries)EcuadorEgypt, Arab Rep.El SalvadorEquatorial GuineaEritreaEstoniaEthiopiaEuro areaEurope & Central AsiaEurope & Central Asia (excluding high income)Europe & Central Asia (IDA & IBRD countries)European UnionFijiFinlandFragile and conflict affected situationsFranceFrench PolynesiaGabonGambia, TheGeorgiaGermanyGhanaGreeceGrenadaGuatemalaGuineaGuinea-BissauGuyanaHeavily indebted poor countries (HIPC)High incomeHondurasHong Kong SAR, ChinaHungaryIBRD onlyIcelandIDA & IBRD totalIDA blendIDA onlyIDA totalIndiaIndonesiaIran, Islamic Rep.IrelandItalyJamaicaJapanJordanKazakhstanKenyaKiribatiKorea, Rep.KosovoKuwaitKyrgyz RepublicLao PDRLate-demographic dividendLatin America & Caribbean Latin America & Caribbean (excluding high income)Latin America & the Caribbean (IDA & IBRD countries)LatviaLeast developed countries: UN classificationLebanonLesothoLibyaLithuaniaLow & middle incomeLow incomeLower middle incomeLuxembourgMacao SAR, ChinaMacedonia, FYRMadagascarMalawiMalaysiaMaldivesMaliMaltaMarshall IslandsMauritaniaMauritiusMexicoMicronesia, Fed. Sts.Middle East & North AfricaMiddle East & North Africa (excluding high income)Middle East & North Africa (IDA & IBRD countries)Middle incomeMoldovaMongoliaMontenegroMoroccoMozambiqueMyanmarNamibiaNepalNetherlandsNew CaledoniaNew ZealandNicaraguaNigerNigeriaNorth AmericaNorwayOECD membersOmanOther small statesPacific island small statesPakistanPalauPanamaPapua New GuineaParaguayPeruPhilippinesPolandPortugalPost-demographic dividendPre-demographic dividendPuerto RicoQatarRomaniaRussian FederationRwandaSao Tome and PrincipeSaudi ArabiaSenegalSerbiaSeychellesSierra LeoneSingaporeSlovak RepublicSloveniaSmall statesSolomon IslandsSomaliaSouth AfricaSouth AsiaSouth Asia (IDA & IBRD)SpainSri LankaSt. Kitts and NevisSt. LuciaSt. Vincent and the GrenadinesSub-Saharan Africa Sub-Saharan Africa (excluding high income)Sub-Saharan Africa (IDA & IBRD countries)SudanSurinameSwazilandSwedenSwitzerlandSyrian Arab RepublicTajikistanTanzaniaThailandTimor-LesteTogoTongaTrinidad and TobagoTunisiaTurkeyTurkmenistanTuvaluUgandaUkraineUnited KingdomUnited StatesUpper middle incomeUruguayUzbekistanVanuatuVenezuela, RBVietnamWest Bank and GazaWorldYemen, Rep.ZambiaZimbabwe Timeline:
This timeline shows a graph from 1961 to 2015 of Iran, Islamic Rep.. No data until 1960. Number of actual observations by date: 55.
Source name:
World Development Indicators
Source organization:
World Bank national accounts data, and OECD National Accounts data files.
Categories, topics:
Agriculture & Rural Development, Economy & Growth, Climate Change
Last updated:
apr 23, 2017
Indicators value changes by year
Maximum:
27.474
jan 1, 1961
At the date of observation
Value
Absolute change
Change from previous value
jan 1, 1961
27.474
+27.474
0.0%
jan 1, 1962
26.295
-1.179
-4.29%
jan 1, 1963
25.121
-1.174
-4.47%
jan 1, 1964
23.543
-1.578
-6.28%
jan 1, 1965
21.88
-1.663
-7.06%
jan 1, 1966
19.646
-2.234
-10.21%
jan 1, 1967
18.595
-1.051
-5.35%
jan 1, 1968
17.573
-1.022
-5.5%
jan 1, 1969
16.902
-0.672
-3.82%
jan 1, 1970
15.47
-1.432
-8.47%
jan 1, 1971
13.848
-1.622
-10.48%
jan 1, 1972
13.477
-0.371
-2.68%
jan 1, 1973
12.627
-0.85
-6.31%
jan 1, 1974
10.253
-2.374
-18.8%
jan 1, 1975
7.013
-3.24
-31.6%
jan 1, 1976
6.803
-0.21
-2.99%
jan 1, 1977
6.621
-0.182
-2.68%
jan 1, 1978
5.839
-0.782
-11.81%
jan 1, 1979
7.686
+1.847
31.63%
jan 1, 1980
8.578
+0.892
11.6%
jan 1, 1981
11.305
+2.727
31.8%
jan 1, 1982
13.89
+2.585
22.86%
jan 1, 1983
13.001
-0.889
-6.4%
jan 1, 1984
11.395
-1.606
-12.35%
jan 1, 1985
12.743
+1.348
11.83%
jan 1, 1986
13.231
+0.489
3.84%
jan 1, 1987
15.775
+2.544
19.23%
jan 1, 1988
16.825
+1.049
6.65%
jan 1, 1989
15.744
-1.081
-6.43%
jan 1, 1990
15.979
+0.235
1.49%
jan 1, 1991
12.763
-3.216
-20.13%
jan 1, 1992
12.322
-0.441
-3.45%
jan 1, 1993
12.391
+0.069
0.56%
jan 1, 1994
10.391
-2.0
-16.14%
jan 1, 1995
10.461
+0.07
0.68%
jan 1, 1996
12.468
+2.007
19.18%
jan 1, 1997
10.323
-2.145
-17.2%
jan 1, 1998
9.841
-0.482
-4.67%
jan 1, 1999
11.575
+1.734
17.62%
jan 1, 2000
9.962
-1.613
-13.94%
jan 1, 2001
9.126
-0.836
-8.39%
jan 1, 2002
8.392
-0.735
-8.05%
jan 1, 2003
7.898
-0.493
-5.88%
jan 1, 2004
7.536
-0.362
-4.59%
jan 1, 2005
7.189
-0.347
-4.6%
jan 1, 2006
6.62
-0.569
-7.91%
jan 1, 2007
7.221
+0.6
9.07%
jan 1, 2008
7.392
+0.171
2.37%
jan 1, 2009
6.394
-0.998
-13.5%
jan 1, 2010
7.337
+0.943
14.75%
jan 1, 2011
6.857
-0.48
-6.54%
jan 1, 2012
5.879
-0.978
-14.26%
jan 1, 2013
7.875
+1.996
33.96%
jan 1, 2014
9.03
+1.154
14.66%
jan 1, 2015
9.337
+0.308
3.41%
Ranking of countries by current statistics by years


Comments: