29
/
en
AIzaSyAYiBZKx7MnpbEhh9jyipgxe19OcubqV5w
April 1, 2024
50638
Middle income
MIC
false
2
1
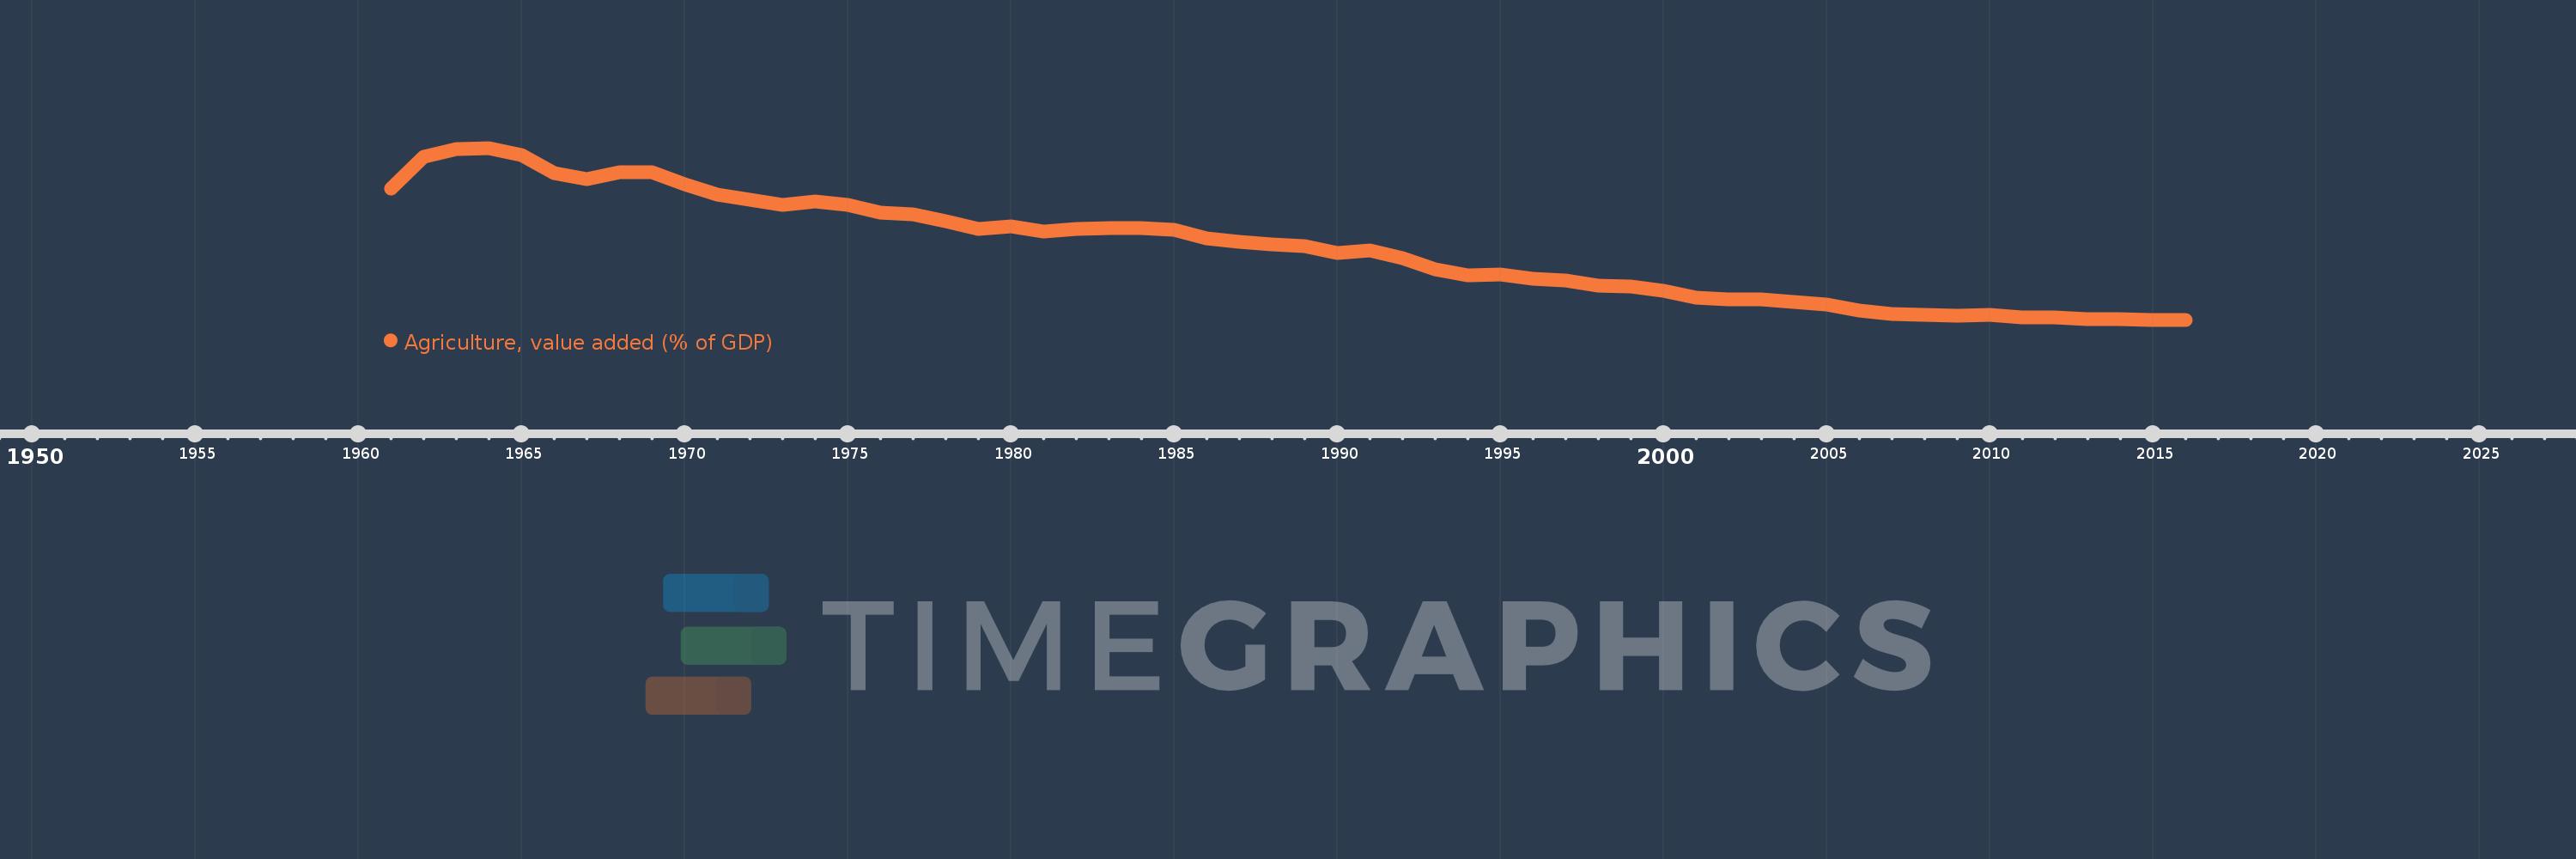
Agriculture, value added (% of GDP)
2016,2015,2014,2013,2012,2011,2010,2009,2008,2007,2006,2005,2004,2003,2002,2001,2000,1999,1998,1997,1996,1995,1994,1993,1992,1991,1990,1989,1988,1987,1986,1985,1984,1983,1982,1981,1980,1979,1978,1977,1976,1975,1974,1973,1972,1971,1970,1969,1968,1967,1966,1965,1964,1963,1962,1961
This statistics in other country:
AfghanistanAlbaniaAlgeriaAndorraAngolaAntigua and BarbudaArab WorldArgentinaArmeniaArubaAustraliaAustriaAzerbaijanBahamas, TheBahrainBangladeshBarbadosBelarusBelgiumBelizeBeninBermudaBhutanBoliviaBosnia and HerzegovinaBotswanaBrazilBrunei DarussalamBulgariaBurkina FasoBurundiCabo VerdeCambodiaCameroonCanadaCaribbean small statesCayman IslandsCentral African RepublicCentral Europe and the BalticsChadChileChinaColombiaComorosCongo, Dem. Rep.Congo, Rep.Costa RicaCote d'IvoireCroatiaCubaCyprusCzech RepublicDenmarkDjiboutiDominicaDominican RepublicEarly-demographic dividendEast Asia & PacificEast Asia & Pacific (excluding high income)East Asia & Pacific (IDA & IBRD countries)EcuadorEgypt, Arab Rep.El SalvadorEquatorial GuineaEritreaEstoniaEthiopiaEuro areaEurope & Central AsiaEurope & Central Asia (excluding high income)Europe & Central Asia (IDA & IBRD countries)European UnionFijiFinlandFragile and conflict affected situationsFranceFrench PolynesiaGabonGambia, TheGeorgiaGermanyGhanaGreeceGrenadaGuatemalaGuineaGuinea-BissauGuyanaHeavily indebted poor countries (HIPC)High incomeHondurasHong Kong SAR, ChinaHungaryIBRD onlyIcelandIDA & IBRD totalIDA blendIDA onlyIDA totalIndiaIndonesiaIran, Islamic Rep.IrelandItalyJamaicaJapanJordanKazakhstanKenyaKiribatiKorea, Rep.KosovoKuwaitKyrgyz RepublicLao PDRLate-demographic dividendLatin America & Caribbean Latin America & Caribbean (excluding high income)Latin America & the Caribbean (IDA & IBRD countries)LatviaLeast developed countries: UN classificationLebanonLesothoLibyaLithuaniaLow & middle incomeLow incomeLower middle incomeLuxembourgMacao SAR, ChinaMacedonia, FYRMadagascarMalawiMalaysiaMaldivesMaliMaltaMarshall IslandsMauritaniaMauritiusMexicoMicronesia, Fed. Sts.Middle East & North AfricaMiddle East & North Africa (excluding high income)Middle East & North Africa (IDA & IBRD countries)Middle incomeMoldovaMongoliaMontenegroMoroccoMozambiqueMyanmarNamibiaNepalNetherlandsNew CaledoniaNew ZealandNicaraguaNigerNigeriaNorth AmericaNorwayOECD membersOmanOther small statesPacific island small statesPakistanPalauPanamaPapua New GuineaParaguayPeruPhilippinesPolandPortugalPost-demographic dividendPre-demographic dividendPuerto RicoQatarRomaniaRussian FederationRwandaSao Tome and PrincipeSaudi ArabiaSenegalSerbiaSeychellesSierra LeoneSingaporeSlovak RepublicSloveniaSmall statesSolomon IslandsSomaliaSouth AfricaSouth AsiaSouth Asia (IDA & IBRD)SpainSri LankaSt. Kitts and NevisSt. LuciaSt. Vincent and the GrenadinesSub-Saharan Africa Sub-Saharan Africa (excluding high income)Sub-Saharan Africa (IDA & IBRD countries)SudanSurinameSwazilandSwedenSwitzerlandSyrian Arab RepublicTajikistanTanzaniaThailandTimor-LesteTogoTongaTrinidad and TobagoTunisiaTurkeyTurkmenistanTuvaluUgandaUkraineUnited KingdomUnited StatesUpper middle incomeUruguayUzbekistanVanuatuVenezuela, RBVietnamWest Bank and GazaWorldYemen, Rep.ZambiaZimbabwe Timeline:
This timeline shows a graph from 1961 to 2016 of Middle income. No data until 1960. Number of actual observations by date: 56.
Source name:
World Development Indicators
Source organization:
World Bank national accounts data, and OECD National Accounts data files.
Categories, topics:
Agriculture & Rural Development, Economy & Growth, Climate Change
Last updated:
apr 23, 2017
Indicators value changes by year
Maximum:
35.661
jan 1, 1964
At the date of observation
Value
Absolute change
Change from previous value
jan 1, 1961
29.463
+29.463
0.0%
jan 1, 1962
34.245
+4.781
16.23%
jan 1, 1963
35.514
+1.269
3.71%
jan 1, 1964
35.661
+0.147
0.41%
jan 1, 1965
34.602
-1.059
-2.97%
jan 1, 1966
31.746
-2.857
-8.26%
jan 1, 1967
30.875
-0.871
-2.74%
jan 1, 1968
31.875
+1.0
3.24%
jan 1, 1969
31.971
+0.096
0.3%
jan 1, 1970
30.091
-1.879
-5.88%
jan 1, 1971
28.516
-1.575
-5.23%
jan 1, 1972
27.654
-0.862
-3.02%
jan 1, 1973
26.902
-0.752
-2.72%
jan 1, 1974
27.432
+0.529
1.97%
jan 1, 1975
26.949
-0.483
-1.76%
jan 1, 1976
25.763
-1.186
-4.4%
jan 1, 1977
25.48
-0.283
-1.1%
jan 1, 1978
24.447
-1.034
-4.06%
jan 1, 1979
23.28
-1.167
-4.77%
jan 1, 1980
23.661
+0.381
1.64%
jan 1, 1981
22.872
-0.789
-3.33%
jan 1, 1982
23.265
+0.392
1.71%
jan 1, 1983
23.375
+0.111
0.48%
jan 1, 1984
23.371
-0.004
-0.02%
jan 1, 1985
23.123
-0.248
-1.06%
jan 1, 1986
21.722
-1.401
-6.06%
jan 1, 1987
21.278
-0.444
-2.04%
jan 1, 1988
20.862
-0.416
-1.95%
jan 1, 1989
20.591
-0.272
-1.3%
jan 1, 1990
19.566
-1.024
-4.98%
jan 1, 1991
19.959
+0.393
2.01%
jan 1, 1992
18.665
-1.293
-6.48%
jan 1, 1993
16.972
-1.694
-9.07%
jan 1, 1994
16.037
-0.934
-5.51%
jan 1, 1995
16.157
+0.12
0.75%
jan 1, 1996
15.502
-0.655
-4.05%
jan 1, 1997
15.355
-0.147
-0.95%
jan 1, 1998
14.545
-0.81
-5.28%
jan 1, 1999
14.328
-0.217
-1.49%
jan 1, 2000
13.692
-0.636
-4.44%
jan 1, 2001
12.622
-1.069
-7.81%
jan 1, 2002
12.434
-0.189
-1.49%
jan 1, 2003
12.359
-0.075
-0.6%
jan 1, 2004
11.993
-0.366
-2.96%
jan 1, 2005
11.606
-0.387
-3.23%
jan 1, 2006
10.703
-0.903
-7.78%
jan 1, 2007
10.088
-0.615
-5.75%
jan 1, 2008
9.995
-0.094
-0.93%
jan 1, 2009
9.948
-0.046
-0.46%
jan 1, 2010
9.961
+0.013
0.13%
jan 1, 2011
9.617
-0.344
-3.46%
jan 1, 2012
9.571
-0.046
-0.48%
jan 1, 2013
9.41
-0.161
-1.68%
jan 1, 2014
9.418
+0.008
0.09%
jan 1, 2015
9.269
-0.149
-1.58%
jan 1, 2016
9.268
-0.001
-0.01%
Ranking of countries by current statistics by years


Comments: