29
/
en
AIzaSyAYiBZKx7MnpbEhh9jyipgxe19OcubqV5w
April 1, 2024
121739
Dominican Republic
DOM
true
2
1
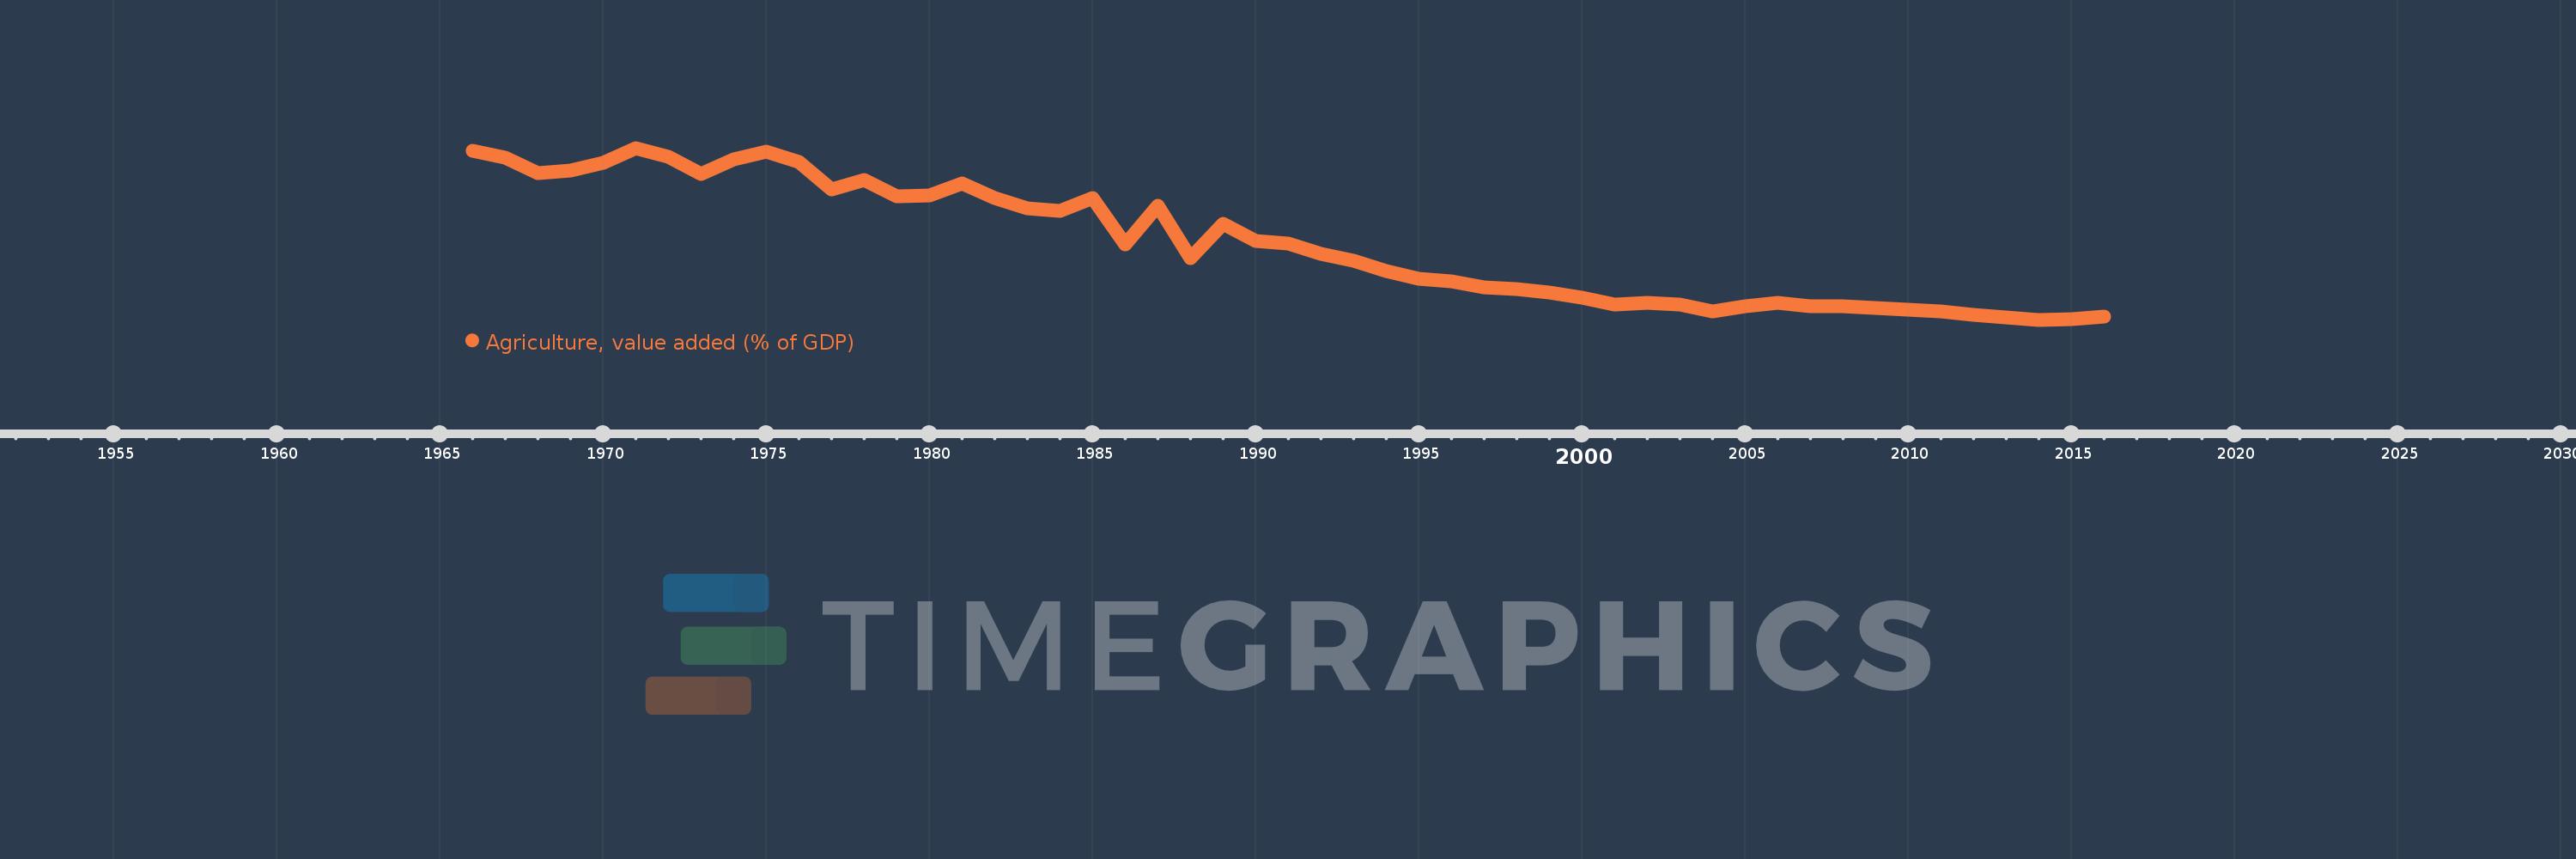
Agriculture, value added (% of GDP)
2016,2015,2014,2013,2012,2011,2010,2009,2008,2007,2006,2005,2004,2003,2002,2001,2000,1999,1998,1997,1996,1995,1994,1993,1992,1991,1990,1989,1988,1987,1986,1985,1984,1983,1982,1981,1980,1979,1978,1977,1976,1975,1974,1973,1972,1971,1970,1969,1968,1967,1966
This statistics in other country:
AfghanistanAlbaniaAlgeriaAndorraAngolaAntigua and BarbudaArab WorldArgentinaArmeniaArubaAustraliaAustriaAzerbaijanBahamas, TheBahrainBangladeshBarbadosBelarusBelgiumBelizeBeninBermudaBhutanBoliviaBosnia and HerzegovinaBotswanaBrazilBrunei DarussalamBulgariaBurkina FasoBurundiCabo VerdeCambodiaCameroonCanadaCaribbean small statesCayman IslandsCentral African RepublicCentral Europe and the BalticsChadChileChinaColombiaComorosCongo, Dem. Rep.Congo, Rep.Costa RicaCote d'IvoireCroatiaCubaCyprusCzech RepublicDenmarkDjiboutiDominicaDominican RepublicEarly-demographic dividendEast Asia & PacificEast Asia & Pacific (excluding high income)East Asia & Pacific (IDA & IBRD countries)EcuadorEgypt, Arab Rep.El SalvadorEquatorial GuineaEritreaEstoniaEthiopiaEuro areaEurope & Central AsiaEurope & Central Asia (excluding high income)Europe & Central Asia (IDA & IBRD countries)European UnionFijiFinlandFragile and conflict affected situationsFranceFrench PolynesiaGabonGambia, TheGeorgiaGermanyGhanaGreeceGrenadaGuatemalaGuineaGuinea-BissauGuyanaHeavily indebted poor countries (HIPC)High incomeHondurasHong Kong SAR, ChinaHungaryIBRD onlyIcelandIDA & IBRD totalIDA blendIDA onlyIDA totalIndiaIndonesiaIran, Islamic Rep.IrelandItalyJamaicaJapanJordanKazakhstanKenyaKiribatiKorea, Rep.KosovoKuwaitKyrgyz RepublicLao PDRLate-demographic dividendLatin America & Caribbean Latin America & Caribbean (excluding high income)Latin America & the Caribbean (IDA & IBRD countries)LatviaLeast developed countries: UN classificationLebanonLesothoLibyaLithuaniaLow & middle incomeLow incomeLower middle incomeLuxembourgMacao SAR, ChinaMacedonia, FYRMadagascarMalawiMalaysiaMaldivesMaliMaltaMarshall IslandsMauritaniaMauritiusMexicoMicronesia, Fed. Sts.Middle East & North AfricaMiddle East & North Africa (excluding high income)Middle East & North Africa (IDA & IBRD countries)Middle incomeMoldovaMongoliaMontenegroMoroccoMozambiqueMyanmarNamibiaNepalNetherlandsNew CaledoniaNew ZealandNicaraguaNigerNigeriaNorth AmericaNorwayOECD membersOmanOther small statesPacific island small statesPakistanPalauPanamaPapua New GuineaParaguayPeruPhilippinesPolandPortugalPost-demographic dividendPre-demographic dividendPuerto RicoQatarRomaniaRussian FederationRwandaSao Tome and PrincipeSaudi ArabiaSenegalSerbiaSeychellesSierra LeoneSingaporeSlovak RepublicSloveniaSmall statesSolomon IslandsSomaliaSouth AfricaSouth AsiaSouth Asia (IDA & IBRD)SpainSri LankaSt. Kitts and NevisSt. LuciaSt. Vincent and the GrenadinesSub-Saharan Africa Sub-Saharan Africa (excluding high income)Sub-Saharan Africa (IDA & IBRD countries)SudanSurinameSwazilandSwedenSwitzerlandSyrian Arab RepublicTajikistanTanzaniaThailandTimor-LesteTogoTongaTrinidad and TobagoTunisiaTurkeyTurkmenistanTuvaluUgandaUkraineUnited KingdomUnited StatesUpper middle incomeUruguayUzbekistanVanuatuVenezuela, RBVietnamWest Bank and GazaWorldYemen, Rep.ZambiaZimbabwe Timeline:
This timeline shows a graph from 1966 to 2016 of Dominican Republic. No data until 1965. Number of actual observations by date: 51.
Source name:
World Development Indicators
Source organization:
World Bank national accounts data, and OECD National Accounts data files.
Categories, topics:
Agriculture & Rural Development, Economy & Growth, Climate Change
Last updated:
apr 23, 2017
Indicators value changes by year
Maximum:
26.049
jan 1, 1971
At the date of observation
Value
Absolute change
Change from previous value
jan 1, 1966
25.684
+25.684
0.0%
jan 1, 1967
24.864
-0.82
-3.19%
jan 1, 1968
22.997
-1.867
-7.51%
jan 1, 1969
23.298
+0.301
1.31%
jan 1, 1970
24.28
+0.982
4.22%
jan 1, 1971
26.049
+1.769
7.29%
jan 1, 1972
24.941
-1.108
-4.25%
jan 1, 1973
22.949
-1.992
-7.99%
jan 1, 1974
24.63
+1.681
7.33%
jan 1, 1975
25.637
+1.007
4.09%
jan 1, 1976
24.4
-1.237
-4.82%
jan 1, 1977
21.112
-3.288
-13.48%
jan 1, 1978
22.247
+1.135
5.38%
jan 1, 1979
20.275
-1.972
-8.87%
jan 1, 1980
20.36
+0.085
0.42%
jan 1, 1981
21.816
+1.456
7.15%
jan 1, 1982
20.071
-1.744
-8.0%
jan 1, 1983
18.836
-1.235
-6.16%
jan 1, 1984
18.452
-0.384
-2.04%
jan 1, 1985
20.07
+1.619
8.77%
jan 1, 1986
14.462
-5.609
-27.94%
jan 1, 1987
19.105
+4.643
32.11%
jan 1, 1988
12.796
-6.309
-33.02%
jan 1, 1989
16.977
+4.182
32.68%
jan 1, 1990
14.908
-2.069
-12.19%
jan 1, 1991
14.511
-0.397
-2.66%
jan 1, 1992
13.341
-1.17
-8.07%
jan 1, 1993
12.536
-0.805
-6.04%
jan 1, 1994
11.232
-1.304
-10.4%
jan 1, 1995
10.298
-0.934
-8.31%
jan 1, 1996
10.006
-0.292
-2.84%
jan 1, 1997
9.271
-0.735
-7.34%
jan 1, 1998
9.064
-0.208
-2.24%
jan 1, 1999
8.717
-0.346
-3.82%
jan 1, 2000
8.025
-0.692
-7.94%
jan 1, 2001
7.245
-0.78
-9.72%
jan 1, 2002
7.462
+0.217
2.99%
jan 1, 2003
7.21
-0.252
-3.38%
jan 1, 2004
6.419
-0.791
-10.97%
jan 1, 2005
6.988
+0.569
8.86%
jan 1, 2006
7.454
+0.466
6.67%
jan 1, 2007
7.058
-0.396
-5.31%
jan 1, 2008
7.078
+0.02
0.29%
jan 1, 2009
6.8
-0.278
-3.93%
jan 1, 2010
6.594
-0.207
-3.04%
jan 1, 2011
6.448
-0.145
-2.2%
jan 1, 2012
6.015
-0.433
-6.72%
jan 1, 2013
5.738
-0.277
-4.61%
jan 1, 2014
5.408
-0.33
-5.76%
jan 1, 2015
5.44
+0.032
0.6%
jan 1, 2016
5.787
+0.347
6.37%
Ranking of countries by current statistics by years


Comments: