29
/
en
AIzaSyAYiBZKx7MnpbEhh9jyipgxe19OcubqV5w
April 1, 2024
132881
Finland
FIN
true
2
1
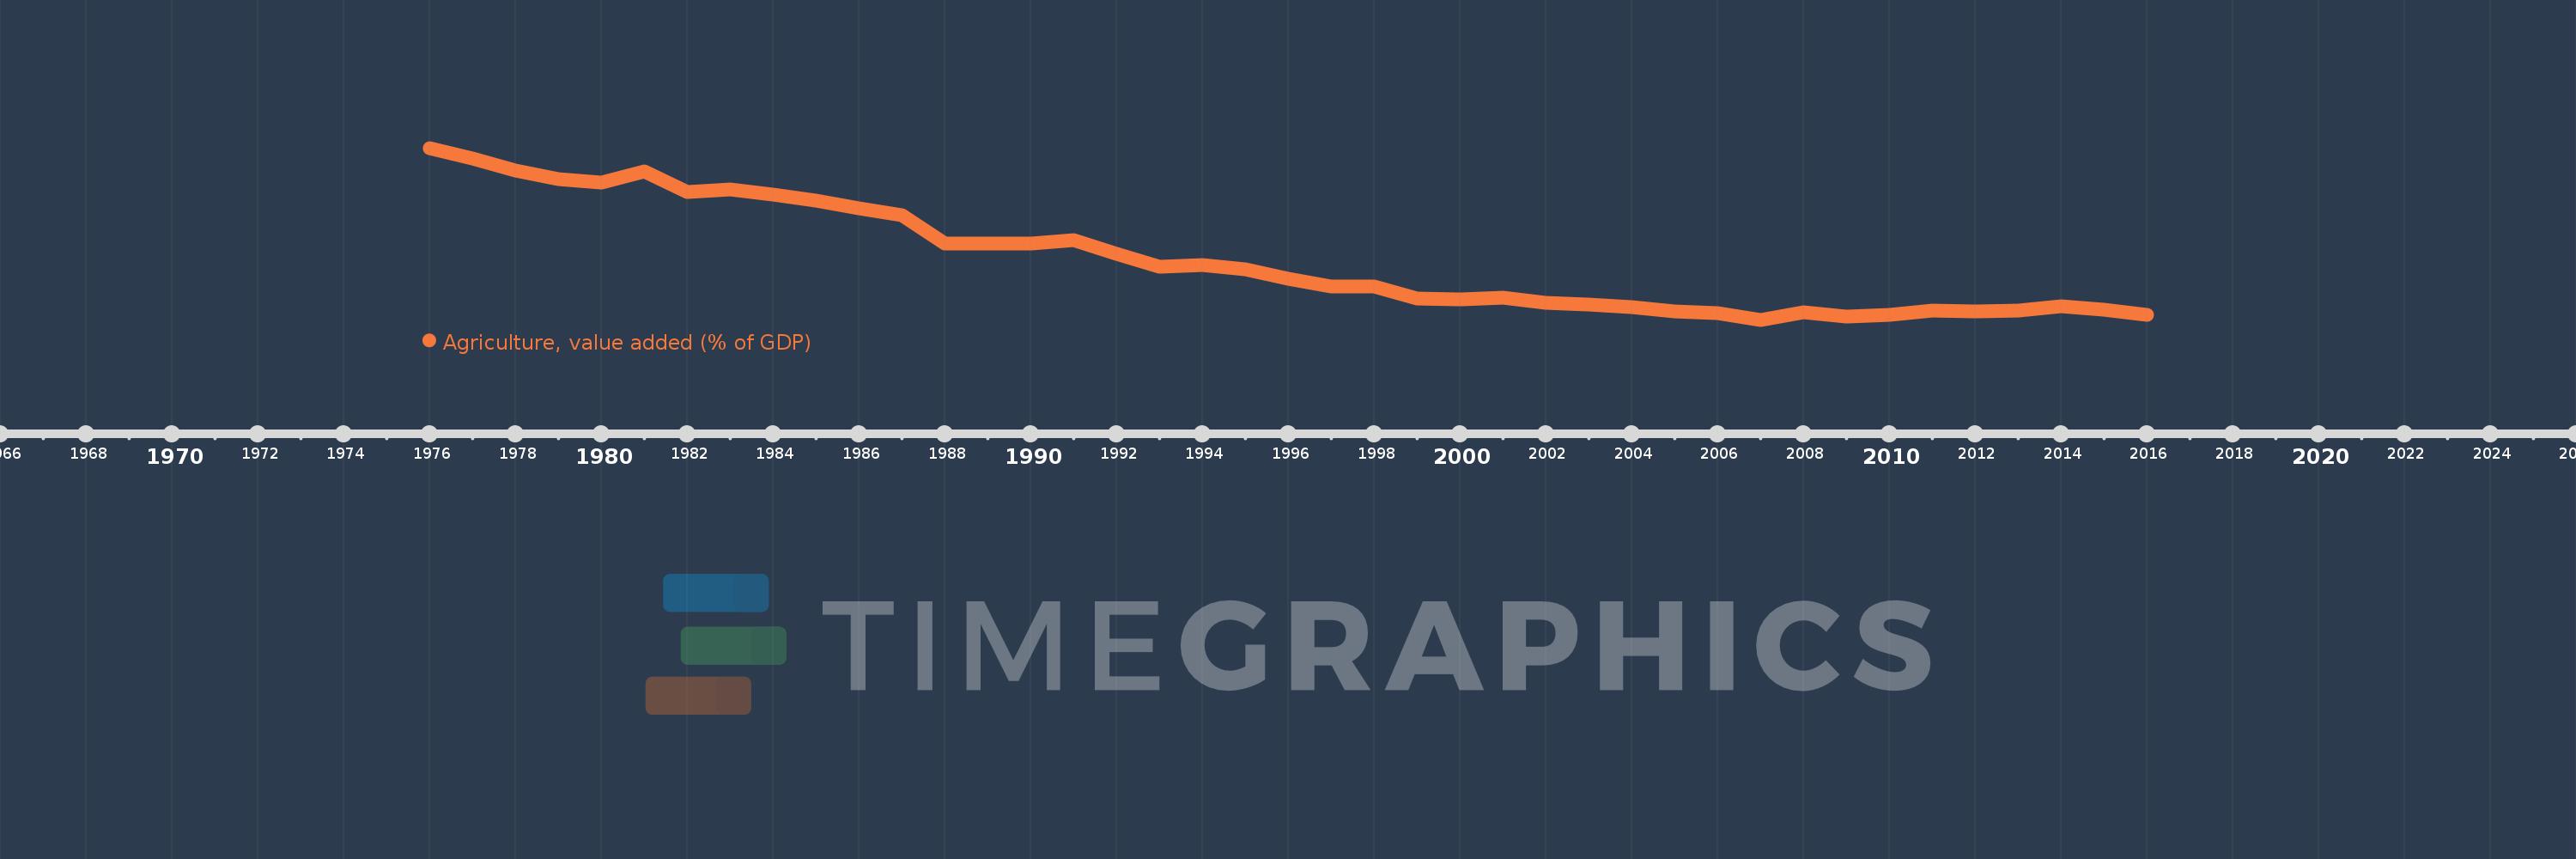
Agriculture, value added (% of GDP)
2016,2015,2014,2013,2012,2011,2010,2009,2008,2007,2006,2005,2004,2003,2002,2001,2000,1999,1998,1997,1996,1995,1994,1993,1992,1991,1990,1989,1988,1987,1986,1985,1984,1983,1982,1981,1980,1979,1978,1977,1976
This statistics in other country:
AfghanistanAlbaniaAlgeriaAndorraAngolaAntigua and BarbudaArab WorldArgentinaArmeniaArubaAustraliaAustriaAzerbaijanBahamas, TheBahrainBangladeshBarbadosBelarusBelgiumBelizeBeninBermudaBhutanBoliviaBosnia and HerzegovinaBotswanaBrazilBrunei DarussalamBulgariaBurkina FasoBurundiCabo VerdeCambodiaCameroonCanadaCaribbean small statesCayman IslandsCentral African RepublicCentral Europe and the BalticsChadChileChinaColombiaComorosCongo, Dem. Rep.Congo, Rep.Costa RicaCote d'IvoireCroatiaCubaCyprusCzech RepublicDenmarkDjiboutiDominicaDominican RepublicEarly-demographic dividendEast Asia & PacificEast Asia & Pacific (excluding high income)East Asia & Pacific (IDA & IBRD countries)EcuadorEgypt, Arab Rep.El SalvadorEquatorial GuineaEritreaEstoniaEthiopiaEuro areaEurope & Central AsiaEurope & Central Asia (excluding high income)Europe & Central Asia (IDA & IBRD countries)European UnionFijiFinlandFragile and conflict affected situationsFranceFrench PolynesiaGabonGambia, TheGeorgiaGermanyGhanaGreeceGrenadaGuatemalaGuineaGuinea-BissauGuyanaHeavily indebted poor countries (HIPC)High incomeHondurasHong Kong SAR, ChinaHungaryIBRD onlyIcelandIDA & IBRD totalIDA blendIDA onlyIDA totalIndiaIndonesiaIran, Islamic Rep.IrelandItalyJamaicaJapanJordanKazakhstanKenyaKiribatiKorea, Rep.KosovoKuwaitKyrgyz RepublicLao PDRLate-demographic dividendLatin America & Caribbean Latin America & Caribbean (excluding high income)Latin America & the Caribbean (IDA & IBRD countries)LatviaLeast developed countries: UN classificationLebanonLesothoLibyaLithuaniaLow & middle incomeLow incomeLower middle incomeLuxembourgMacao SAR, ChinaMacedonia, FYRMadagascarMalawiMalaysiaMaldivesMaliMaltaMarshall IslandsMauritaniaMauritiusMexicoMicronesia, Fed. Sts.Middle East & North AfricaMiddle East & North Africa (excluding high income)Middle East & North Africa (IDA & IBRD countries)Middle incomeMoldovaMongoliaMontenegroMoroccoMozambiqueMyanmarNamibiaNepalNetherlandsNew CaledoniaNew ZealandNicaraguaNigerNigeriaNorth AmericaNorwayOECD membersOmanOther small statesPacific island small statesPakistanPalauPanamaPapua New GuineaParaguayPeruPhilippinesPolandPortugalPost-demographic dividendPre-demographic dividendPuerto RicoQatarRomaniaRussian FederationRwandaSao Tome and PrincipeSaudi ArabiaSenegalSerbiaSeychellesSierra LeoneSingaporeSlovak RepublicSloveniaSmall statesSolomon IslandsSomaliaSouth AfricaSouth AsiaSouth Asia (IDA & IBRD)SpainSri LankaSt. Kitts and NevisSt. LuciaSt. Vincent and the GrenadinesSub-Saharan Africa Sub-Saharan Africa (excluding high income)Sub-Saharan Africa (IDA & IBRD countries)SudanSurinameSwazilandSwedenSwitzerlandSyrian Arab RepublicTajikistanTanzaniaThailandTimor-LesteTogoTongaTrinidad and TobagoTunisiaTurkeyTurkmenistanTuvaluUgandaUkraineUnited KingdomUnited StatesUpper middle incomeUruguayUzbekistanVanuatuVenezuela, RBVietnamWest Bank and GazaWorldYemen, Rep.ZambiaZimbabwe Timeline:
This timeline shows a graph from 1976 to 2016 of Finland. No data until 1975. Number of actual observations by date: 41.
Source name:
World Development Indicators
Source organization:
World Bank national accounts data, and OECD National Accounts data files.
Categories, topics:
Agriculture & Rural Development, Economy & Growth, Climate Change
Last updated:
apr 23, 2017
Indicators value changes by year
Maximum:
10.766
jan 1, 1976
At the date of observation
Value
Absolute change
Change from previous value
jan 1, 1976
10.766
+10.766
0.0%
jan 1, 1977
10.246
-0.52
-4.83%
jan 1, 1978
9.652
-0.594
-5.8%
jan 1, 1979
9.247
-0.405
-4.2%
jan 1, 1980
9.075
-0.172
-1.86%
jan 1, 1981
9.592
+0.517
5.69%
jan 1, 1982
8.594
-0.998
-10.4%
jan 1, 1983
8.731
+0.137
1.59%
jan 1, 1984
8.484
-0.247
-2.82%
jan 1, 1985
8.188
-0.296
-3.49%
jan 1, 1986
7.801
-0.387
-4.73%
jan 1, 1987
7.462
-0.339
-4.35%
jan 1, 1988
6.036
-1.426
-19.11%
jan 1, 1989
6.049
+0.013
0.22%
jan 1, 1990
6.061
+0.011
0.19%
jan 1, 1991
6.207
+0.147
2.42%
jan 1, 1992
5.542
-0.665
-10.72%
jan 1, 1993
4.902
-0.64
-11.55%
jan 1, 1994
4.999
+0.097
1.99%
jan 1, 1995
4.782
-0.217
-4.34%
jan 1, 1996
4.333
-0.449
-9.38%
jan 1, 1997
3.949
-0.385
-8.88%
jan 1, 1998
3.948
0.0
0.0%
jan 1, 1999
3.337
-0.612
-15.49%
jan 1, 2000
3.317
-0.02
-0.6%
jan 1, 2001
3.381
+0.064
1.93%
jan 1, 2002
3.145
-0.236
-6.97%
jan 1, 2003
3.052
-0.093
-2.97%
jan 1, 2004
2.91
-0.142
-4.65%
jan 1, 2005
2.723
-0.187
-6.42%
jan 1, 2006
2.612
-0.11
-4.06%
jan 1, 2007
2.299
-0.313
-11.98%
jan 1, 2008
2.683
+0.384
16.69%
jan 1, 2009
2.464
-0.219
-8.17%
jan 1, 2010
2.544
+0.08
3.24%
jan 1, 2011
2.731
+0.187
7.35%
jan 1, 2012
2.727
-0.003
-0.12%
jan 1, 2013
2.733
+0.006
0.22%
jan 1, 2014
2.984
+0.25
9.16%
jan 1, 2015
2.79
-0.194
-6.52%
jan 1, 2016
2.545
-0.244
-8.75%
Ranking of countries by current statistics by years


Comments: