29
/
en
AIzaSyAYiBZKx7MnpbEhh9jyipgxe19OcubqV5w
April 1, 2024
116622
Cyprus
CYP
true
2
1
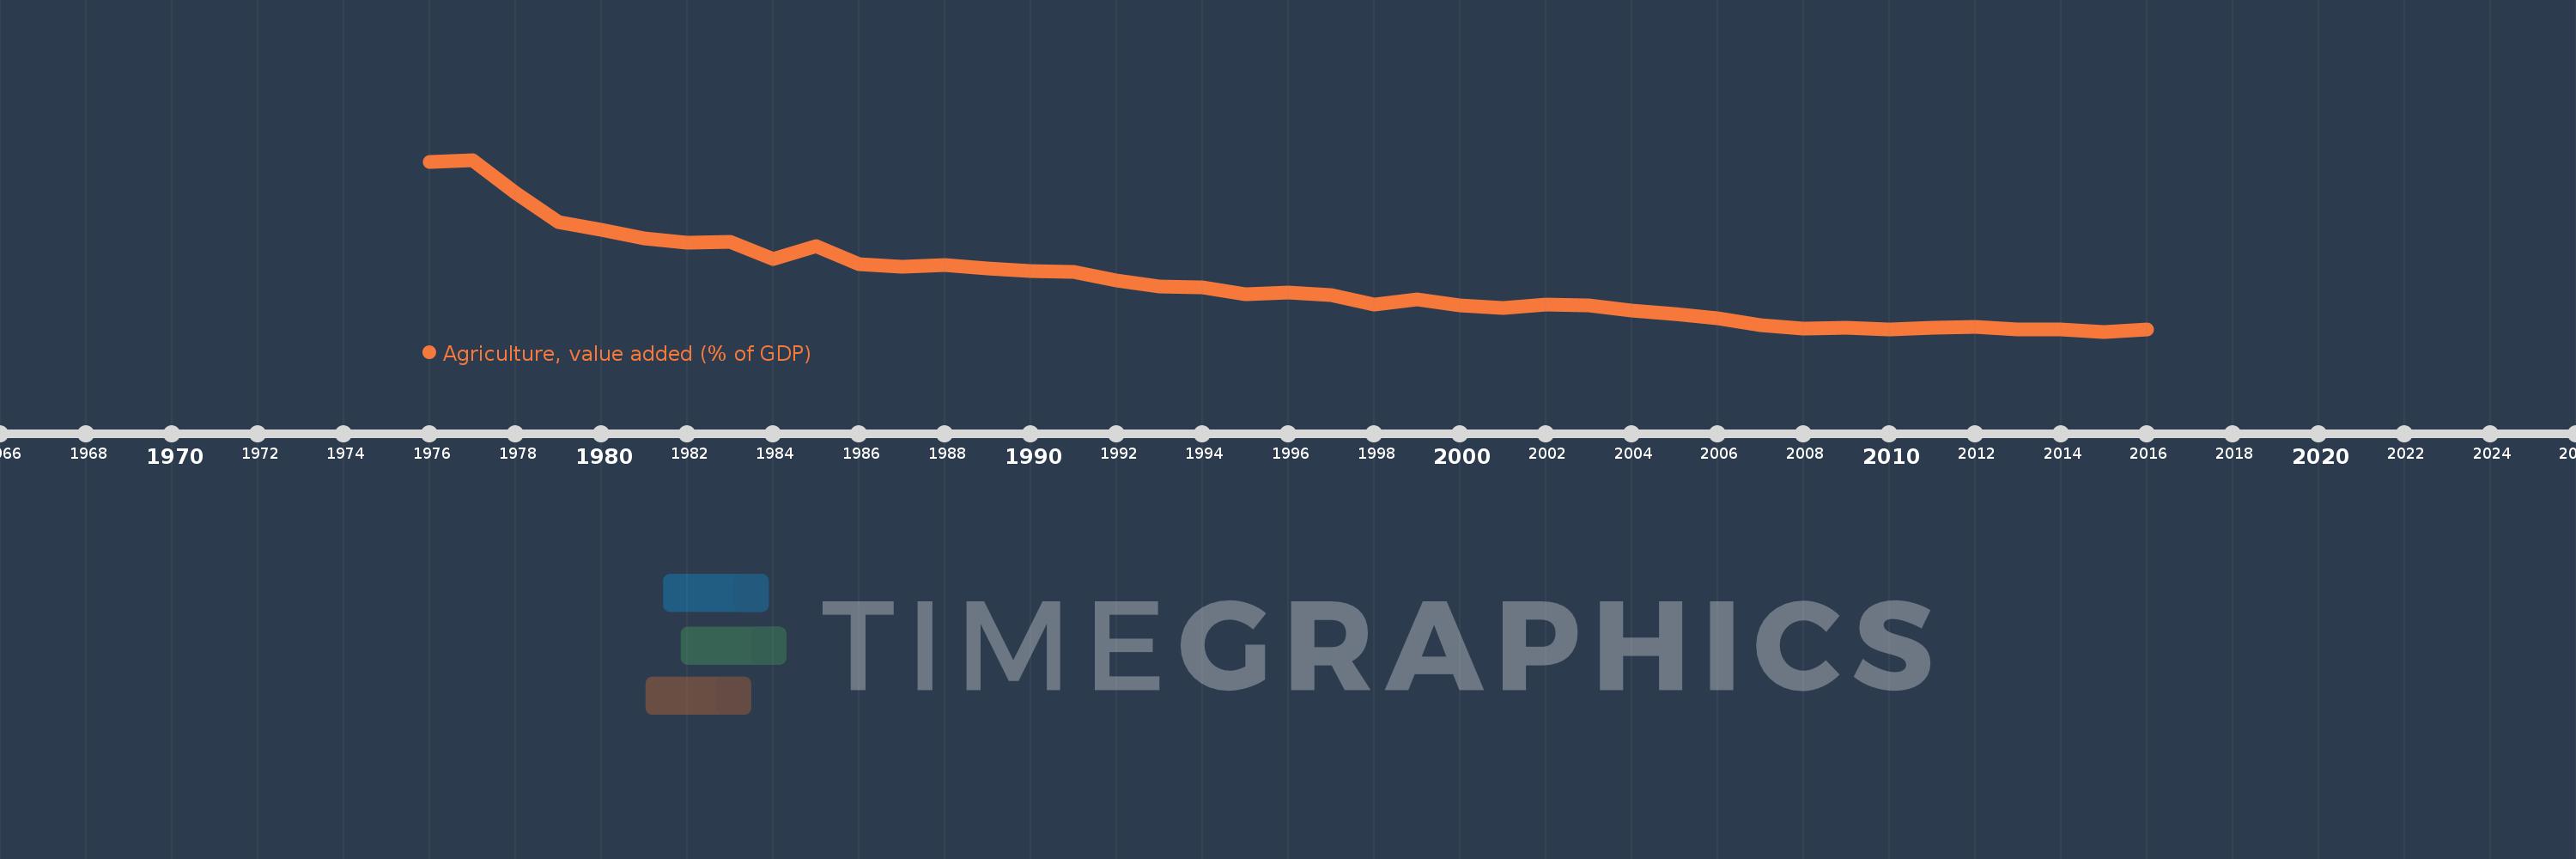
Agriculture, value added (% of GDP)
2016,2015,2014,2013,2012,2011,2010,2009,2008,2007,2006,2005,2004,2003,2002,2001,2000,1999,1998,1997,1996,1995,1994,1993,1992,1991,1990,1989,1988,1987,1986,1985,1984,1983,1982,1981,1980,1979,1978,1977,1976
This statistics in other country:
AfghanistanAlbaniaAlgeriaAndorraAngolaAntigua and BarbudaArab WorldArgentinaArmeniaArubaAustraliaAustriaAzerbaijanBahamas, TheBahrainBangladeshBarbadosBelarusBelgiumBelizeBeninBermudaBhutanBoliviaBosnia and HerzegovinaBotswanaBrazilBrunei DarussalamBulgariaBurkina FasoBurundiCabo VerdeCambodiaCameroonCanadaCaribbean small statesCayman IslandsCentral African RepublicCentral Europe and the BalticsChadChileChinaColombiaComorosCongo, Dem. Rep.Congo, Rep.Costa RicaCote d'IvoireCroatiaCubaCyprusCzech RepublicDenmarkDjiboutiDominicaDominican RepublicEarly-demographic dividendEast Asia & PacificEast Asia & Pacific (excluding high income)East Asia & Pacific (IDA & IBRD countries)EcuadorEgypt, Arab Rep.El SalvadorEquatorial GuineaEritreaEstoniaEthiopiaEuro areaEurope & Central AsiaEurope & Central Asia (excluding high income)Europe & Central Asia (IDA & IBRD countries)European UnionFijiFinlandFragile and conflict affected situationsFranceFrench PolynesiaGabonGambia, TheGeorgiaGermanyGhanaGreeceGrenadaGuatemalaGuineaGuinea-BissauGuyanaHeavily indebted poor countries (HIPC)High incomeHondurasHong Kong SAR, ChinaHungaryIBRD onlyIcelandIDA & IBRD totalIDA blendIDA onlyIDA totalIndiaIndonesiaIran, Islamic Rep.IrelandItalyJamaicaJapanJordanKazakhstanKenyaKiribatiKorea, Rep.KosovoKuwaitKyrgyz RepublicLao PDRLate-demographic dividendLatin America & Caribbean Latin America & Caribbean (excluding high income)Latin America & the Caribbean (IDA & IBRD countries)LatviaLeast developed countries: UN classificationLebanonLesothoLibyaLithuaniaLow & middle incomeLow incomeLower middle incomeLuxembourgMacao SAR, ChinaMacedonia, FYRMadagascarMalawiMalaysiaMaldivesMaliMaltaMarshall IslandsMauritaniaMauritiusMexicoMicronesia, Fed. Sts.Middle East & North AfricaMiddle East & North Africa (excluding high income)Middle East & North Africa (IDA & IBRD countries)Middle incomeMoldovaMongoliaMontenegroMoroccoMozambiqueMyanmarNamibiaNepalNetherlandsNew CaledoniaNew ZealandNicaraguaNigerNigeriaNorth AmericaNorwayOECD membersOmanOther small statesPacific island small statesPakistanPalauPanamaPapua New GuineaParaguayPeruPhilippinesPolandPortugalPost-demographic dividendPre-demographic dividendPuerto RicoQatarRomaniaRussian FederationRwandaSao Tome and PrincipeSaudi ArabiaSenegalSerbiaSeychellesSierra LeoneSingaporeSlovak RepublicSloveniaSmall statesSolomon IslandsSomaliaSouth AfricaSouth AsiaSouth Asia (IDA & IBRD)SpainSri LankaSt. Kitts and NevisSt. LuciaSt. Vincent and the GrenadinesSub-Saharan Africa Sub-Saharan Africa (excluding high income)Sub-Saharan Africa (IDA & IBRD countries)SudanSurinameSwazilandSwedenSwitzerlandSyrian Arab RepublicTajikistanTanzaniaThailandTimor-LesteTogoTongaTrinidad and TobagoTunisiaTurkeyTurkmenistanTuvaluUgandaUkraineUnited KingdomUnited StatesUpper middle incomeUruguayUzbekistanVanuatuVenezuela, RBVietnamWest Bank and GazaWorldYemen, Rep.ZambiaZimbabwe Timeline:
This timeline shows a graph from 1976 to 2016 of Cyprus. No data until 1975. Number of actual observations by date: 41.
Source name:
World Development Indicators
Source organization:
World Bank national accounts data, and OECD National Accounts data files.
Categories, topics:
Agriculture & Rural Development, Economy & Growth, Climate Change
Last updated:
apr 23, 2017
Indicators value changes by year
Maximum:
15.903
jan 1, 1977
At the date of observation
Value
Absolute change
Change from previous value
jan 1, 1976
15.72
+15.72
0.0%
jan 1, 1977
15.903
+0.183
1.16%
jan 1, 1978
13.212
-2.691
-16.92%
jan 1, 1979
10.918
-2.294
-17.36%
jan 1, 1980
10.241
-0.677
-6.2%
jan 1, 1981
9.588
-0.653
-6.38%
jan 1, 1982
9.258
-0.33
-3.45%
jan 1, 1983
9.269
+0.011
0.12%
jan 1, 1984
7.9
-1.369
-14.77%
jan 1, 1985
8.943
+1.043
13.2%
jan 1, 1986
7.489
-1.454
-16.26%
jan 1, 1987
7.327
-0.162
-2.16%
jan 1, 1988
7.432
+0.105
1.43%
jan 1, 1989
7.175
-0.257
-3.46%
jan 1, 1990
6.93
-0.245
-3.41%
jan 1, 1991
6.859
-0.071
-1.02%
jan 1, 1992
6.191
-0.668
-9.74%
jan 1, 1993
5.724
-0.468
-7.55%
jan 1, 1994
5.613
-0.111
-1.94%
jan 1, 1995
5.068
-0.545
-9.71%
jan 1, 1996
5.233
+0.166
3.27%
jan 1, 1997
4.992
-0.241
-4.61%
jan 1, 1998
4.251
-0.741
-14.85%
jan 1, 1999
4.667
+0.416
9.8%
jan 1, 2000
4.209
-0.458
-9.81%
jan 1, 2001
4.003
-0.206
-4.89%
jan 1, 2002
4.262
+0.259
6.47%
jan 1, 2003
4.203
-0.059
-1.38%
jan 1, 2004
3.779
-0.424
-10.08%
jan 1, 2005
3.505
-0.274
-7.26%
jan 1, 2006
3.135
-0.37
-10.56%
jan 1, 2007
2.613
-0.521
-16.64%
jan 1, 2008
2.344
-0.269
-10.29%
jan 1, 2009
2.424
+0.079
3.38%
jan 1, 2010
2.262
-0.162
-6.68%
jan 1, 2011
2.389
+0.127
5.61%
jan 1, 2012
2.463
+0.074
3.09%
jan 1, 2013
2.233
-0.229
-9.31%
jan 1, 2014
2.265
+0.031
1.41%
jan 1, 2015
2.082
-0.182
-8.05%
jan 1, 2016
2.274
+0.192
9.21%
Ranking of countries by current statistics by years


Comments: