29
/
en
AIzaSyAYiBZKx7MnpbEhh9jyipgxe19OcubqV5w
April 1, 2024
102126
Central African Republic
CAF
true
2
1
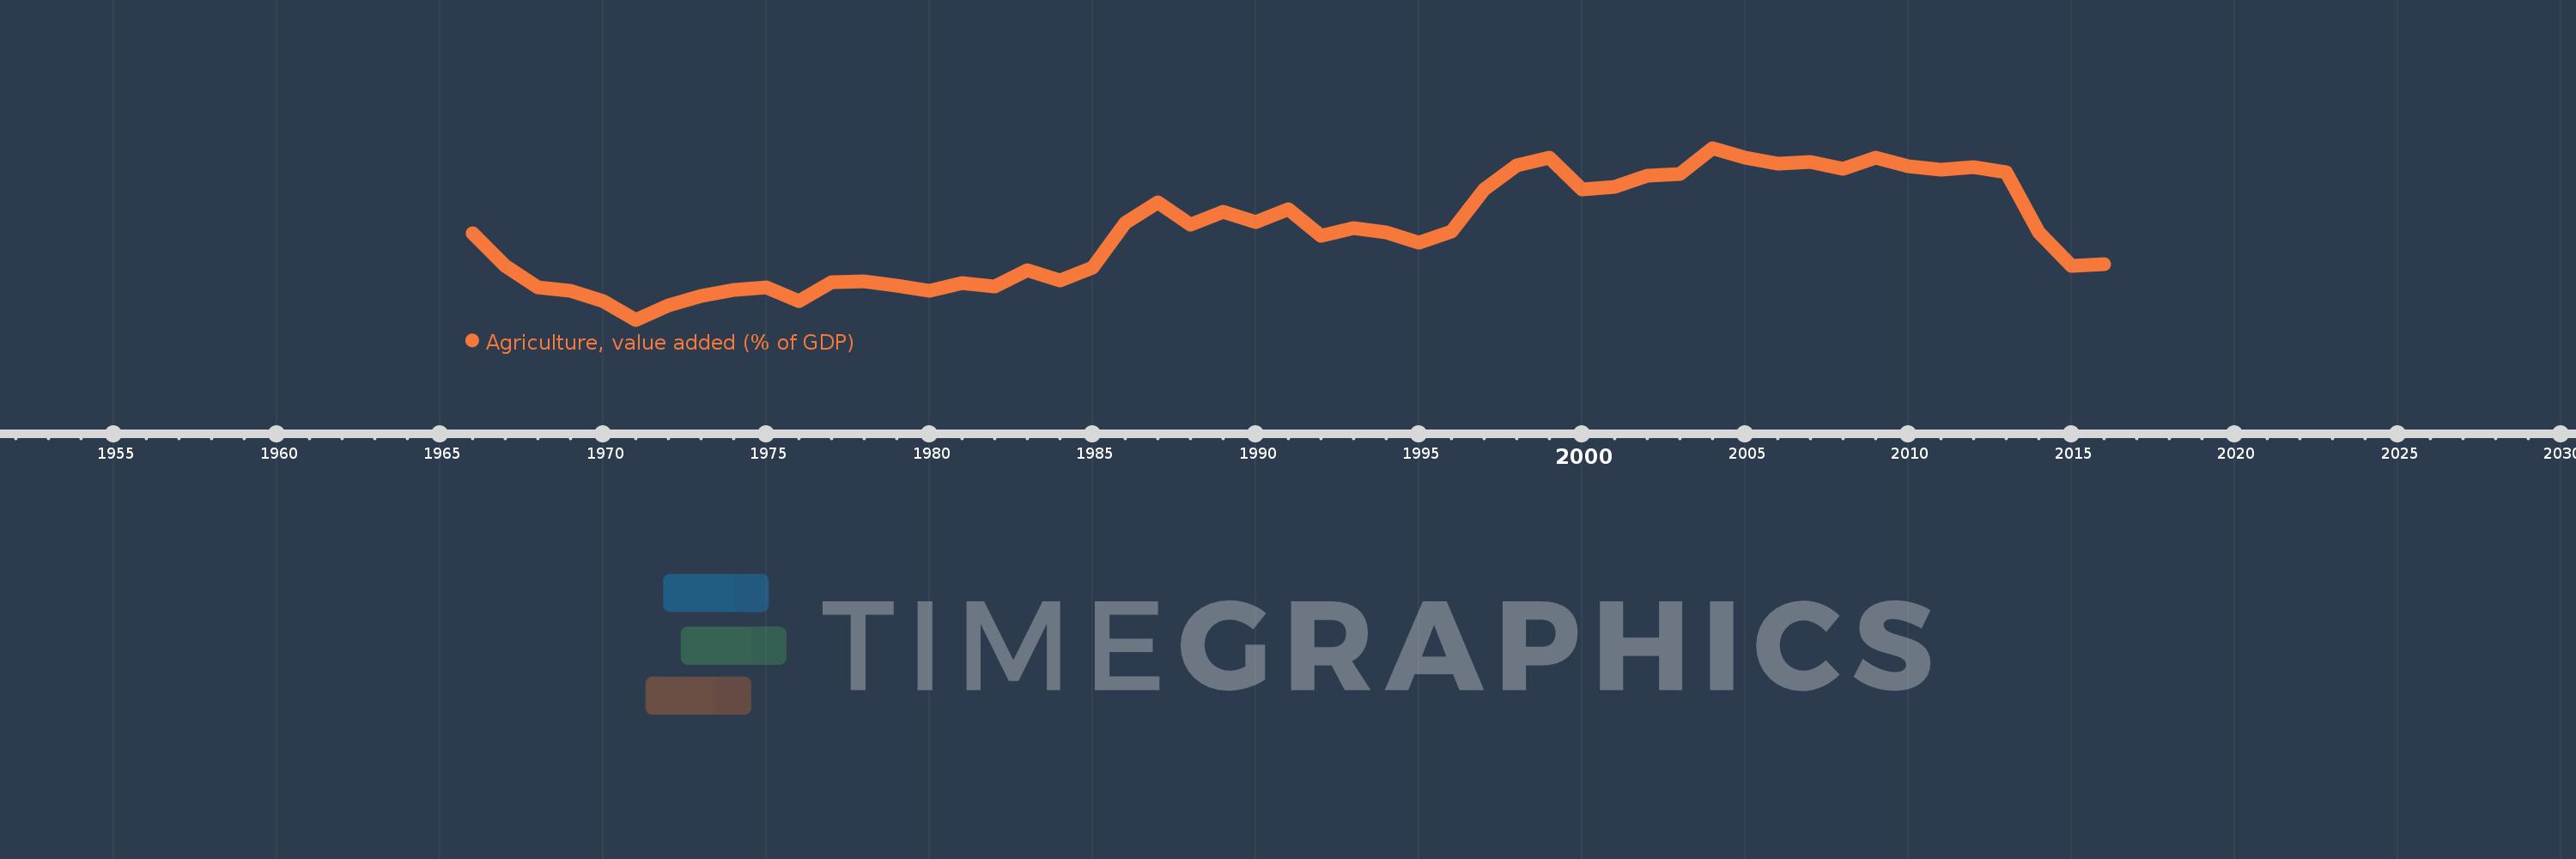
Agriculture, value added (% of GDP)
2016,2015,2014,2013,2012,2011,2010,2009,2008,2007,2006,2005,2004,2003,2002,2001,2000,1999,1998,1997,1996,1995,1994,1993,1992,1991,1990,1989,1988,1987,1986,1985,1984,1983,1982,1981,1980,1979,1978,1977,1976,1975,1974,1973,1972,1971,1970,1969,1968,1967,1966
This statistics in other country:
AfghanistanAlbaniaAlgeriaAndorraAngolaAntigua and BarbudaArab WorldArgentinaArmeniaArubaAustraliaAustriaAzerbaijanBahamas, TheBahrainBangladeshBarbadosBelarusBelgiumBelizeBeninBermudaBhutanBoliviaBosnia and HerzegovinaBotswanaBrazilBrunei DarussalamBulgariaBurkina FasoBurundiCabo VerdeCambodiaCameroonCanadaCaribbean small statesCayman IslandsCentral African RepublicCentral Europe and the BalticsChadChileChinaColombiaComorosCongo, Dem. Rep.Congo, Rep.Costa RicaCote d'IvoireCroatiaCubaCyprusCzech RepublicDenmarkDjiboutiDominicaDominican RepublicEarly-demographic dividendEast Asia & PacificEast Asia & Pacific (excluding high income)East Asia & Pacific (IDA & IBRD countries)EcuadorEgypt, Arab Rep.El SalvadorEquatorial GuineaEritreaEstoniaEthiopiaEuro areaEurope & Central AsiaEurope & Central Asia (excluding high income)Europe & Central Asia (IDA & IBRD countries)European UnionFijiFinlandFragile and conflict affected situationsFranceFrench PolynesiaGabonGambia, TheGeorgiaGermanyGhanaGreeceGrenadaGuatemalaGuineaGuinea-BissauGuyanaHeavily indebted poor countries (HIPC)High incomeHondurasHong Kong SAR, ChinaHungaryIBRD onlyIcelandIDA & IBRD totalIDA blendIDA onlyIDA totalIndiaIndonesiaIran, Islamic Rep.IrelandItalyJamaicaJapanJordanKazakhstanKenyaKiribatiKorea, Rep.KosovoKuwaitKyrgyz RepublicLao PDRLate-demographic dividendLatin America & Caribbean Latin America & Caribbean (excluding high income)Latin America & the Caribbean (IDA & IBRD countries)LatviaLeast developed countries: UN classificationLebanonLesothoLibyaLithuaniaLow & middle incomeLow incomeLower middle incomeLuxembourgMacao SAR, ChinaMacedonia, FYRMadagascarMalawiMalaysiaMaldivesMaliMaltaMarshall IslandsMauritaniaMauritiusMexicoMicronesia, Fed. Sts.Middle East & North AfricaMiddle East & North Africa (excluding high income)Middle East & North Africa (IDA & IBRD countries)Middle incomeMoldovaMongoliaMontenegroMoroccoMozambiqueMyanmarNamibiaNepalNetherlandsNew CaledoniaNew ZealandNicaraguaNigerNigeriaNorth AmericaNorwayOECD membersOmanOther small statesPacific island small statesPakistanPalauPanamaPapua New GuineaParaguayPeruPhilippinesPolandPortugalPost-demographic dividendPre-demographic dividendPuerto RicoQatarRomaniaRussian FederationRwandaSao Tome and PrincipeSaudi ArabiaSenegalSerbiaSeychellesSierra LeoneSingaporeSlovak RepublicSloveniaSmall statesSolomon IslandsSomaliaSouth AfricaSouth AsiaSouth Asia (IDA & IBRD)SpainSri LankaSt. Kitts and NevisSt. LuciaSt. Vincent and the GrenadinesSub-Saharan Africa Sub-Saharan Africa (excluding high income)Sub-Saharan Africa (IDA & IBRD countries)SudanSurinameSwazilandSwedenSwitzerlandSyrian Arab RepublicTajikistanTanzaniaThailandTimor-LesteTogoTongaTrinidad and TobagoTunisiaTurkeyTurkmenistanTuvaluUgandaUkraineUnited KingdomUnited StatesUpper middle incomeUruguayUzbekistanVanuatuVenezuela, RBVietnamWest Bank and GazaWorldYemen, Rep.ZambiaZimbabwe Timeline:
This timeline shows a graph from 1966 to 2016 of Central African Republic. No data until 1965. Number of actual observations by date: 51.
Source name:
World Development Indicators
Source organization:
World Bank national accounts data, and OECD National Accounts data files.
Categories, topics:
Agriculture & Rural Development, Economy & Growth, Climate Change
Last updated:
apr 23, 2017
Indicators value changes by year
Maximum:
56.925
jan 1, 2004
At the date of observation
Value
Absolute change
Change from previous value
jan 1, 1966
46.264
+46.264
0.0%
jan 1, 1967
42.149
-4.116
-8.9%
jan 1, 1968
39.523
-2.626
-6.23%
jan 1, 1969
39.078
-0.445
-1.13%
jan 1, 1970
37.844
-1.234
-3.16%
jan 1, 1971
35.47
-2.374
-6.27%
jan 1, 1972
37.247
+1.777
5.01%
jan 1, 1973
38.491
+1.244
3.34%
jan 1, 1974
39.163
+0.672
1.75%
jan 1, 1975
39.493
+0.33
0.84%
jan 1, 1976
37.748
-1.745
-4.42%
jan 1, 1977
40.119
+2.37
6.28%
jan 1, 1978
40.241
+0.122
0.3%
jan 1, 1979
39.737
-0.504
-1.25%
jan 1, 1980
39.076
-0.661
-1.66%
jan 1, 1981
40.0
+0.924
2.37%
jan 1, 1982
39.674
-0.326
-0.82%
jan 1, 1983
41.674
+2.0
5.04%
jan 1, 1984
40.371
-1.303
-3.13%
jan 1, 1985
42.027
+1.656
4.1%
jan 1, 1986
47.596
+5.57
13.25%
jan 1, 1987
50.177
+2.58
5.42%
jan 1, 1988
47.305
-2.871
-5.72%
jan 1, 1989
48.941
+1.635
3.46%
jan 1, 1990
47.704
-1.237
-2.53%
jan 1, 1991
49.276
+1.572
3.3%
jan 1, 1992
45.971
-3.305
-6.71%
jan 1, 1993
46.869
+0.898
1.95%
jan 1, 1994
46.403
-0.466
-0.99%
jan 1, 1995
45.045
-1.358
-2.93%
jan 1, 1996
46.512
+1.467
3.26%
jan 1, 1997
51.724
+5.212
11.21%
jan 1, 1998
54.779
+3.055
5.91%
jan 1, 1999
55.676
+0.897
1.64%
jan 1, 2000
51.731
-3.945
-7.09%
jan 1, 2001
52.102
+0.371
0.72%
jan 1, 2002
53.413
+1.31
2.52%
jan 1, 2003
53.625
+0.212
0.4%
jan 1, 2004
56.925
+3.3
6.15%
jan 1, 2005
55.706
-1.219
-2.14%
jan 1, 2006
54.939
-0.767
-1.38%
jan 1, 2007
55.181
+0.242
0.44%
jan 1, 2008
54.284
-0.897
-1.63%
jan 1, 2009
55.717
+1.432
2.64%
jan 1, 2010
54.634
-1.082
-1.94%
jan 1, 2011
54.201
-0.433
-0.79%
jan 1, 2012
54.5
+0.299
0.55%
jan 1, 2013
53.939
-0.56
-1.03%
jan 1, 2014
46.433
-7.506
-13.92%
jan 1, 2015
42.163
-4.271
-9.2%
jan 1, 2016
42.363
+0.2
0.47%
Ranking of countries by current statistics by years


Comments: