29
/
en
AIzaSyAYiBZKx7MnpbEhh9jyipgxe19OcubqV5w
April 1, 2024
48720
Middle East & North Africa (excluding high income)
MNA
false
2
1
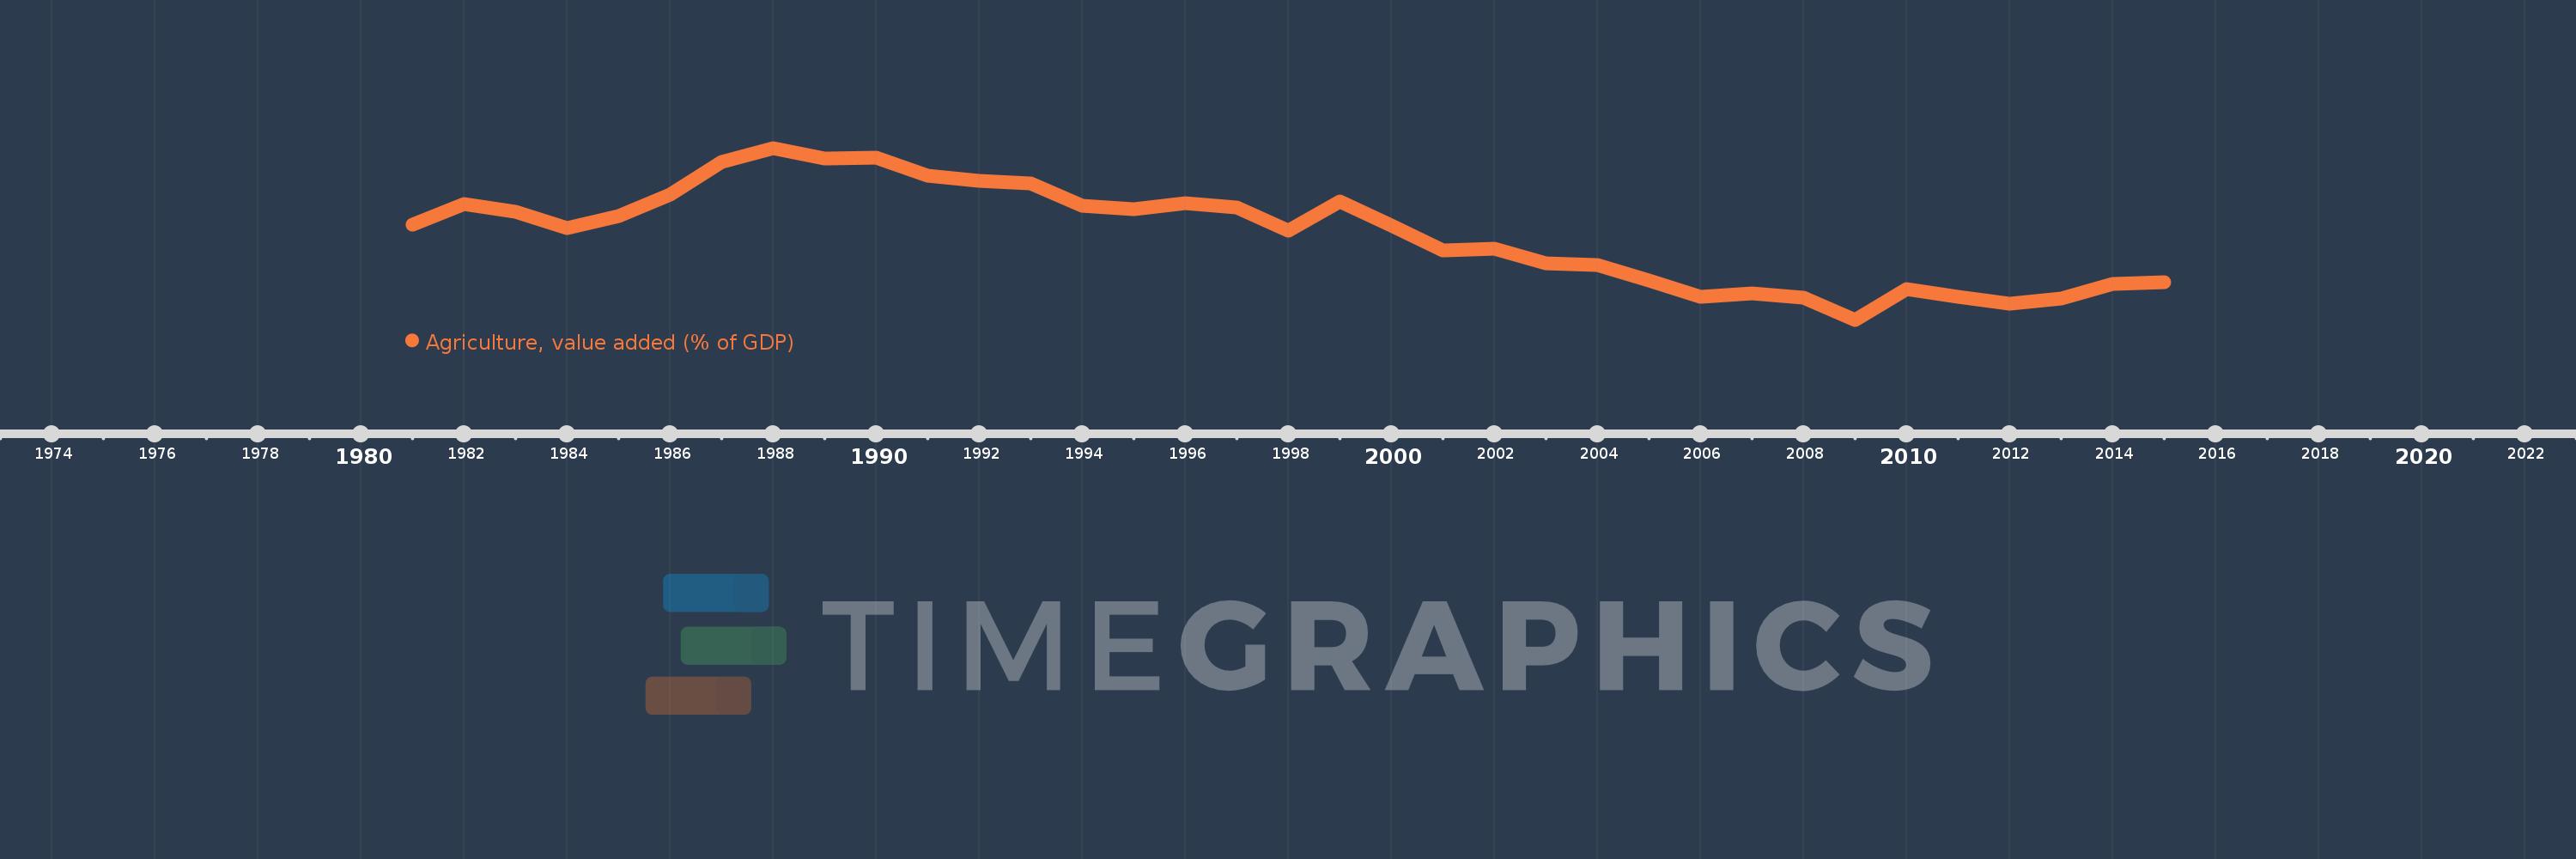
Agriculture, value added (% of GDP)
2015,2014,2013,2012,2011,2010,2009,2008,2007,2006,2005,2004,2003,2002,2001,2000,1999,1998,1997,1996,1995,1994,1993,1992,1991,1990,1989,1988,1987,1986,1985,1984,1983,1982,1981
This statistics in other country:
AfghanistanAlbaniaAlgeriaAndorraAngolaAntigua and BarbudaArab WorldArgentinaArmeniaArubaAustraliaAustriaAzerbaijanBahamas, TheBahrainBangladeshBarbadosBelarusBelgiumBelizeBeninBermudaBhutanBoliviaBosnia and HerzegovinaBotswanaBrazilBrunei DarussalamBulgariaBurkina FasoBurundiCabo VerdeCambodiaCameroonCanadaCaribbean small statesCayman IslandsCentral African RepublicCentral Europe and the BalticsChadChileChinaColombiaComorosCongo, Dem. Rep.Congo, Rep.Costa RicaCote d'IvoireCroatiaCubaCyprusCzech RepublicDenmarkDjiboutiDominicaDominican RepublicEarly-demographic dividendEast Asia & PacificEast Asia & Pacific (excluding high income)East Asia & Pacific (IDA & IBRD countries)EcuadorEgypt, Arab Rep.El SalvadorEquatorial GuineaEritreaEstoniaEthiopiaEuro areaEurope & Central AsiaEurope & Central Asia (excluding high income)Europe & Central Asia (IDA & IBRD countries)European UnionFijiFinlandFragile and conflict affected situationsFranceFrench PolynesiaGabonGambia, TheGeorgiaGermanyGhanaGreeceGrenadaGuatemalaGuineaGuinea-BissauGuyanaHeavily indebted poor countries (HIPC)High incomeHondurasHong Kong SAR, ChinaHungaryIBRD onlyIcelandIDA & IBRD totalIDA blendIDA onlyIDA totalIndiaIndonesiaIran, Islamic Rep.IrelandItalyJamaicaJapanJordanKazakhstanKenyaKiribatiKorea, Rep.KosovoKuwaitKyrgyz RepublicLao PDRLate-demographic dividendLatin America & Caribbean Latin America & Caribbean (excluding high income)Latin America & the Caribbean (IDA & IBRD countries)LatviaLeast developed countries: UN classificationLebanonLesothoLibyaLithuaniaLow & middle incomeLow incomeLower middle incomeLuxembourgMacao SAR, ChinaMacedonia, FYRMadagascarMalawiMalaysiaMaldivesMaliMaltaMarshall IslandsMauritaniaMauritiusMexicoMicronesia, Fed. Sts.Middle East & North AfricaMiddle East & North Africa (excluding high income)Middle East & North Africa (IDA & IBRD countries)Middle incomeMoldovaMongoliaMontenegroMoroccoMozambiqueMyanmarNamibiaNepalNetherlandsNew CaledoniaNew ZealandNicaraguaNigerNigeriaNorth AmericaNorwayOECD membersOmanOther small statesPacific island small statesPakistanPalauPanamaPapua New GuineaParaguayPeruPhilippinesPolandPortugalPost-demographic dividendPre-demographic dividendPuerto RicoQatarRomaniaRussian FederationRwandaSao Tome and PrincipeSaudi ArabiaSenegalSerbiaSeychellesSierra LeoneSingaporeSlovak RepublicSloveniaSmall statesSolomon IslandsSomaliaSouth AfricaSouth AsiaSouth Asia (IDA & IBRD)SpainSri LankaSt. Kitts and NevisSt. LuciaSt. Vincent and the GrenadinesSub-Saharan Africa Sub-Saharan Africa (excluding high income)Sub-Saharan Africa (IDA & IBRD countries)SudanSurinameSwazilandSwedenSwitzerlandSyrian Arab RepublicTajikistanTanzaniaThailandTimor-LesteTogoTongaTrinidad and TobagoTunisiaTurkeyTurkmenistanTuvaluUgandaUkraineUnited KingdomUnited StatesUpper middle incomeUruguayUzbekistanVanuatuVenezuela, RBVietnamWest Bank and GazaWorldYemen, Rep.ZambiaZimbabwe Timeline:
This timeline shows a graph from 1981 to 2015 of Middle East & North Africa (excluding high income). No data until 1980. Number of actual observations by date: 35.
Source name:
World Development Indicators
Source organization:
World Bank national accounts data, and OECD National Accounts data files.
Categories, topics:
Agriculture & Rural Development, Economy & Growth, Climate Change
Last updated:
apr 23, 2017
Indicators value changes by year
Maximum:
16.978
jan 1, 1988
At the date of observation
Value
Absolute change
Change from previous value
jan 1, 1981
12.917
+12.917
0.0%
jan 1, 1982
14.037
+1.12
8.67%
jan 1, 1983
13.598
-0.439
-3.13%
jan 1, 1984
12.735
-0.864
-6.35%
jan 1, 1985
13.398
+0.664
5.21%
jan 1, 1986
14.501
+1.103
8.23%
jan 1, 1987
16.262
+1.761
12.14%
jan 1, 1988
16.978
+0.716
4.4%
jan 1, 1989
16.429
-0.548
-3.23%
jan 1, 1990
16.444
+0.015
0.09%
jan 1, 1991
15.5
-0.944
-5.74%
jan 1, 1992
15.239
-0.261
-1.68%
jan 1, 1993
15.127
-0.112
-0.74%
jan 1, 1994
13.928
-1.199
-7.93%
jan 1, 1995
13.739
-0.188
-1.35%
jan 1, 1996
14.073
+0.334
2.43%
jan 1, 1997
13.833
-0.24
-1.7%
jan 1, 1998
12.641
-1.192
-8.62%
jan 1, 1999
14.139
+1.498
11.85%
jan 1, 2000
12.874
-1.265
-8.95%
jan 1, 2001
11.567
-1.307
-10.15%
jan 1, 2002
11.681
+0.114
0.99%
jan 1, 2003
10.917
-0.763
-6.54%
jan 1, 2004
10.802
-0.116
-1.06%
jan 1, 2005
9.996
-0.806
-7.46%
jan 1, 2006
9.115
-0.88
-8.81%
jan 1, 2007
9.315
+0.2
2.19%
jan 1, 2008
9.071
-0.244
-2.62%
jan 1, 2009
7.924
-1.147
-12.64%
jan 1, 2010
9.554
+1.629
20.56%
jan 1, 2011
9.145
-0.409
-4.28%
jan 1, 2012
8.782
-0.363
-3.97%
jan 1, 2013
9.059
+0.277
3.15%
jan 1, 2014
9.83
+0.772
8.52%
jan 1, 2015
9.915
+0.085
0.86%
Ranking of countries by current statistics by years


Comments: