29
/
en
AIzaSyAYiBZKx7MnpbEhh9jyipgxe19OcubqV5w
April 1, 2024
253871
Suriname
SUR
true
2
1
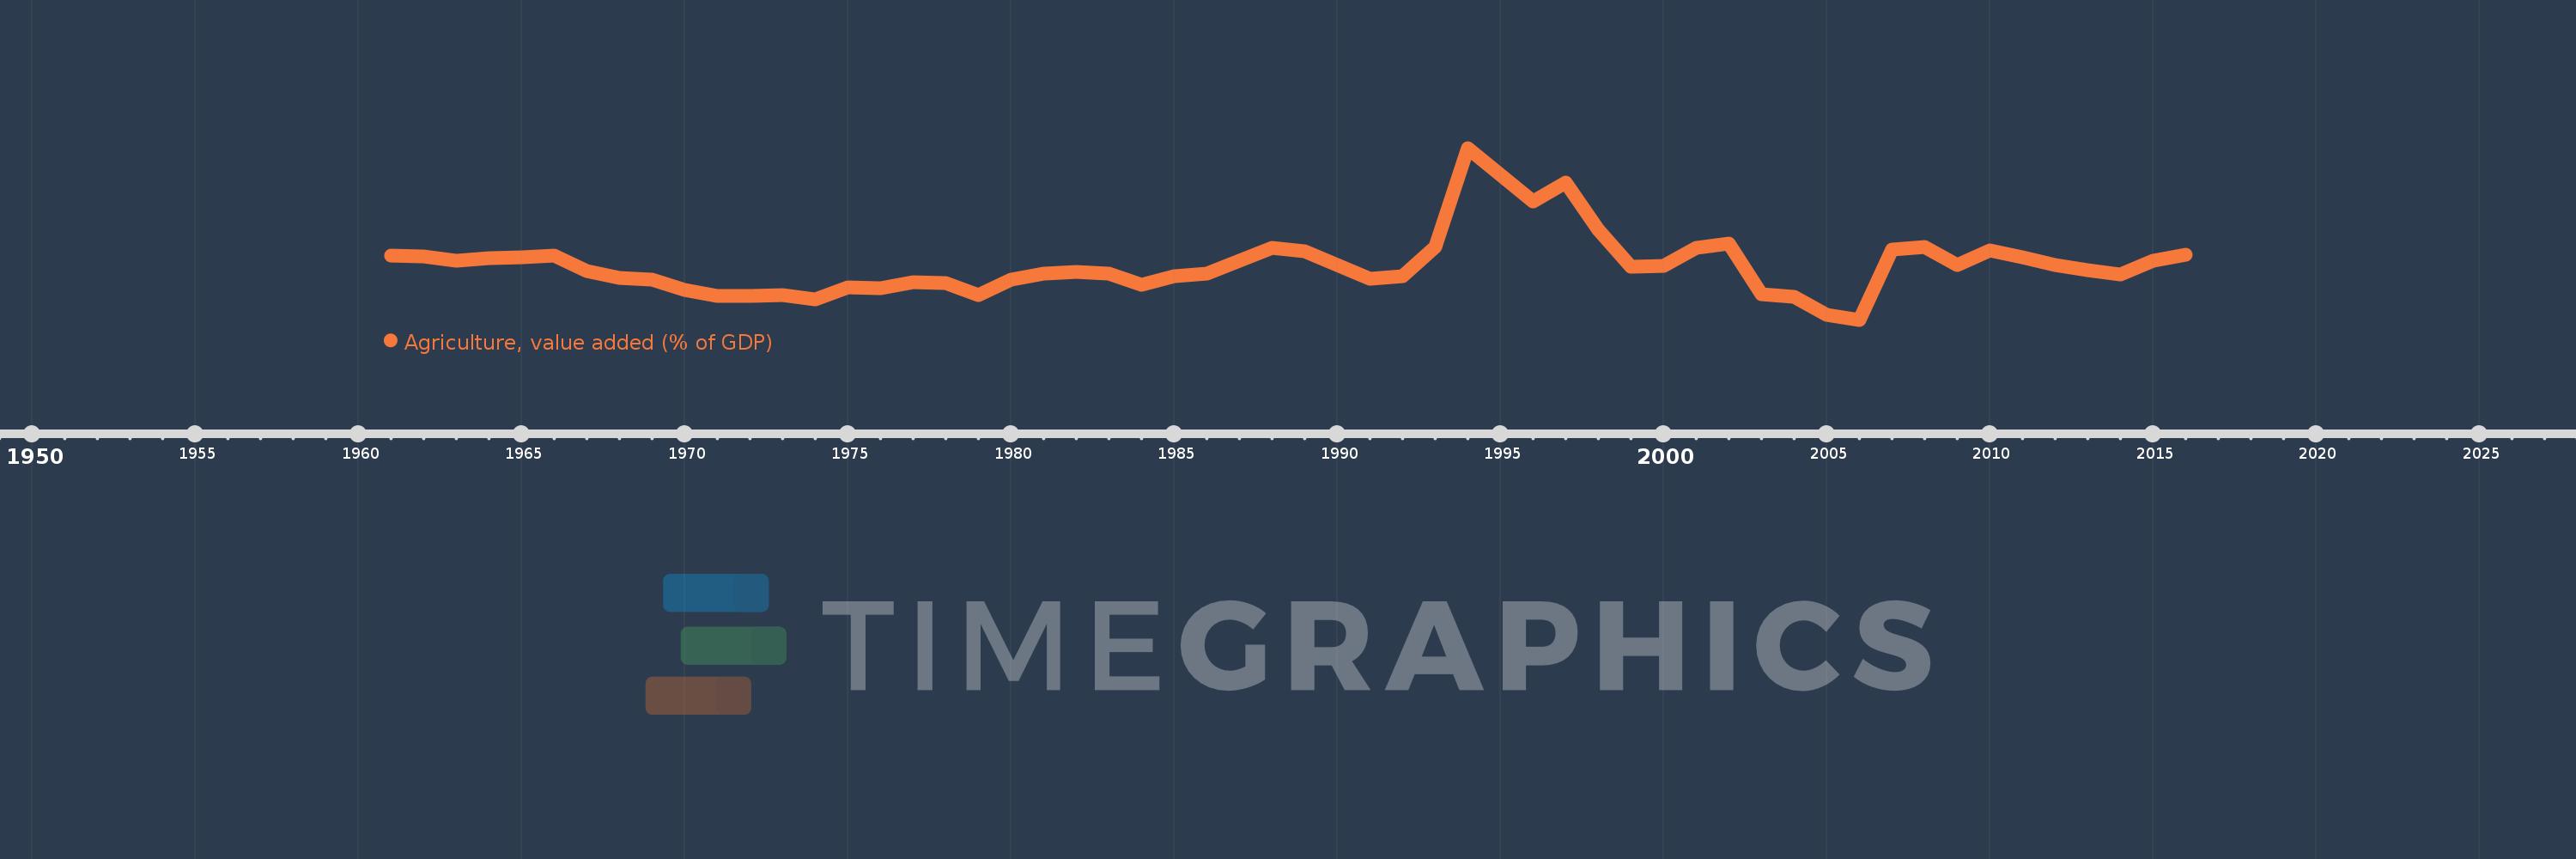
Agriculture, value added (% of GDP)
2016,2015,2014,2013,2012,2011,2010,2009,2008,2007,2006,2005,2004,2003,2002,2001,2000,1999,1998,1997,1996,1995,1994,1993,1992,1991,1990,1989,1988,1987,1986,1985,1984,1983,1982,1981,1980,1979,1978,1977,1976,1975,1974,1973,1972,1971,1970,1969,1968,1967,1966,1965,1964,1963,1962,1961
This statistics in other country:
AfghanistanAlbaniaAlgeriaAndorraAngolaAntigua and BarbudaArab WorldArgentinaArmeniaArubaAustraliaAustriaAzerbaijanBahamas, TheBahrainBangladeshBarbadosBelarusBelgiumBelizeBeninBermudaBhutanBoliviaBosnia and HerzegovinaBotswanaBrazilBrunei DarussalamBulgariaBurkina FasoBurundiCabo VerdeCambodiaCameroonCanadaCaribbean small statesCayman IslandsCentral African RepublicCentral Europe and the BalticsChadChileChinaColombiaComorosCongo, Dem. Rep.Congo, Rep.Costa RicaCote d'IvoireCroatiaCubaCyprusCzech RepublicDenmarkDjiboutiDominicaDominican RepublicEarly-demographic dividendEast Asia & PacificEast Asia & Pacific (excluding high income)East Asia & Pacific (IDA & IBRD countries)EcuadorEgypt, Arab Rep.El SalvadorEquatorial GuineaEritreaEstoniaEthiopiaEuro areaEurope & Central AsiaEurope & Central Asia (excluding high income)Europe & Central Asia (IDA & IBRD countries)European UnionFijiFinlandFragile and conflict affected situationsFranceFrench PolynesiaGabonGambia, TheGeorgiaGermanyGhanaGreeceGrenadaGuatemalaGuineaGuinea-BissauGuyanaHeavily indebted poor countries (HIPC)High incomeHondurasHong Kong SAR, ChinaHungaryIBRD onlyIcelandIDA & IBRD totalIDA blendIDA onlyIDA totalIndiaIndonesiaIran, Islamic Rep.IrelandItalyJamaicaJapanJordanKazakhstanKenyaKiribatiKorea, Rep.KosovoKuwaitKyrgyz RepublicLao PDRLate-demographic dividendLatin America & Caribbean Latin America & Caribbean (excluding high income)Latin America & the Caribbean (IDA & IBRD countries)LatviaLeast developed countries: UN classificationLebanonLesothoLibyaLithuaniaLow & middle incomeLow incomeLower middle incomeLuxembourgMacao SAR, ChinaMacedonia, FYRMadagascarMalawiMalaysiaMaldivesMaliMaltaMarshall IslandsMauritaniaMauritiusMexicoMicronesia, Fed. Sts.Middle East & North AfricaMiddle East & North Africa (excluding high income)Middle East & North Africa (IDA & IBRD countries)Middle incomeMoldovaMongoliaMontenegroMoroccoMozambiqueMyanmarNamibiaNepalNetherlandsNew CaledoniaNew ZealandNicaraguaNigerNigeriaNorth AmericaNorwayOECD membersOmanOther small statesPacific island small statesPakistanPalauPanamaPapua New GuineaParaguayPeruPhilippinesPolandPortugalPost-demographic dividendPre-demographic dividendPuerto RicoQatarRomaniaRussian FederationRwandaSao Tome and PrincipeSaudi ArabiaSenegalSerbiaSeychellesSierra LeoneSingaporeSlovak RepublicSloveniaSmall statesSolomon IslandsSomaliaSouth AfricaSouth AsiaSouth Asia (IDA & IBRD)SpainSri LankaSt. Kitts and NevisSt. LuciaSt. Vincent and the GrenadinesSub-Saharan Africa Sub-Saharan Africa (excluding high income)Sub-Saharan Africa (IDA & IBRD countries)SudanSurinameSwazilandSwedenSwitzerlandSyrian Arab RepublicTajikistanTanzaniaThailandTimor-LesteTogoTongaTrinidad and TobagoTunisiaTurkeyTurkmenistanTuvaluUgandaUkraineUnited KingdomUnited StatesUpper middle incomeUruguayUzbekistanVanuatuVenezuela, RBVietnamWest Bank and GazaWorldYemen, Rep.ZambiaZimbabwe Timeline:
This timeline shows a graph from 1961 to 2016 of Suriname. No data until 1960. Number of actual observations by date: 56.
Source name:
World Development Indicators
Source organization:
World Bank national accounts data, and OECD National Accounts data files.
Categories, topics:
Agriculture & Rural Development, Economy & Growth, Climate Change
Last updated:
apr 23, 2017
Indicators value changes by year
Maximum:
19.191
jan 1, 1994
At the date of observation
Value
Absolute change
Change from previous value
jan 1, 1961
10.538
+10.538
0.0%
jan 1, 1962
10.515
-0.023
-0.22%
jan 1, 1963
10.169
-0.346
-3.29%
jan 1, 1964
10.376
+0.206
2.03%
jan 1, 1965
10.425
+0.049
0.47%
jan 1, 1966
10.589
+0.164
1.58%
jan 1, 1967
9.34
-1.249
-11.8%
jan 1, 1968
8.794
-0.545
-5.84%
jan 1, 1969
8.657
-0.137
-1.56%
jan 1, 1970
7.789
-0.868
-10.02%
jan 1, 1971
7.322
-0.467
-6.0%
jan 1, 1972
7.353
+0.031
0.43%
jan 1, 1973
7.393
+0.04
0.54%
jan 1, 1974
7.027
-0.366
-4.95%
jan 1, 1975
8.044
+1.017
14.47%
jan 1, 1976
7.913
-0.13
-1.62%
jan 1, 1977
8.4
+0.486
6.15%
jan 1, 1978
8.362
-0.038
-0.45%
jan 1, 1979
7.42
-0.942
-11.27%
jan 1, 1980
8.659
+1.239
16.7%
jan 1, 1981
9.142
+0.484
5.59%
jan 1, 1982
9.287
+0.145
1.59%
jan 1, 1983
9.103
-0.184
-1.99%
jan 1, 1984
8.236
-0.867
-9.52%
jan 1, 1985
8.883
+0.647
7.85%
jan 1, 1986
9.127
+0.244
2.75%
jan 1, 1987
10.125
+0.998
10.93%
jan 1, 1988
11.217
+1.093
10.79%
jan 1, 1989
10.931
-0.286
-2.55%
jan 1, 1990
9.79
-1.141
-10.44%
jan 1, 1991
8.705
-1.085
-11.08%
jan 1, 1992
8.898
+0.193
2.22%
jan 1, 1993
11.266
+2.368
26.61%
jan 1, 1994
19.191
+7.925
70.34%
jan 1, 1995
17.007
-2.184
-11.38%
jan 1, 1996
14.875
-2.132
-12.53%
jan 1, 1997
16.39
+1.514
10.18%
jan 1, 1998
12.603
-3.787
-23.1%
jan 1, 1999
9.635
-2.968
-23.55%
jan 1, 2000
9.756
+0.121
1.25%
jan 1, 2001
11.164
+1.408
14.43%
jan 1, 2002
11.554
+0.389
3.49%
jan 1, 2003
7.435
-4.118
-35.64%
jan 1, 2004
7.225
-0.21
-2.83%
jan 1, 2005
5.791
-1.435
-19.85%
jan 1, 2006
5.419
-0.371
-6.41%
jan 1, 2007
11.026
+5.607
103.45%
jan 1, 2008
11.264
+0.238
2.16%
jan 1, 2009
9.805
-1.459
-12.95%
jan 1, 2010
10.943
+1.138
11.6%
jan 1, 2011
10.442
-0.501
-4.58%
jan 1, 2012
9.834
-0.608
-5.82%
jan 1, 2013
9.385
-0.449
-4.57%
jan 1, 2014
9.049
-0.336
-3.58%
jan 1, 2015
10.12
+1.071
11.84%
jan 1, 2016
10.599
+0.479
4.74%
Ranking of countries by current statistics by years


Comments: