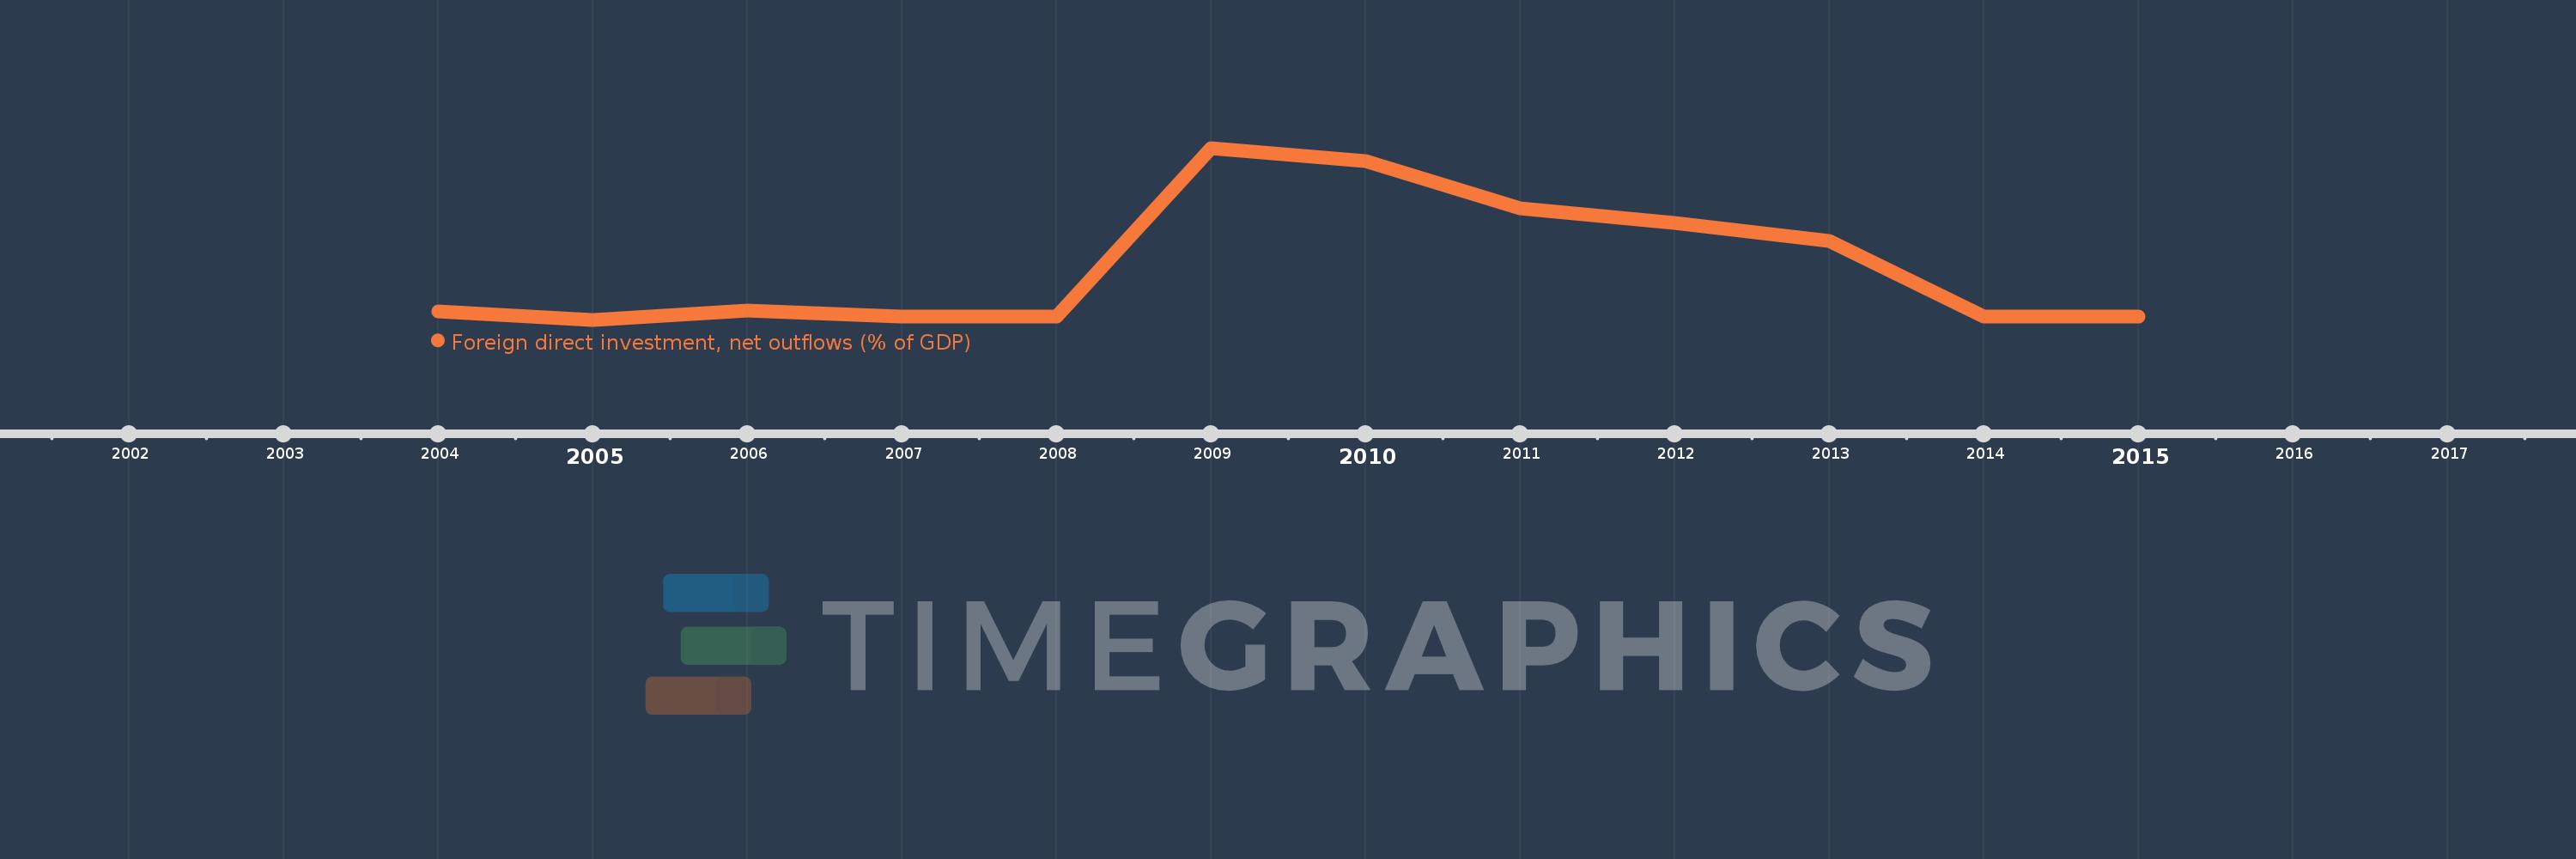
This timeline shows a graph from 2004 to 2015 of Afghanistan. No data until 2003. Number of actual observations by date: 12.
Source name:
World Development Indicators
Source organization:
International Monetary Fund, International Financial Statistics and Balance of Payments databases, World Bank, International Debt Statistics, and World Bank and OECD GDP estimates.
Categories, topics:
Economy & Growth, Financial Sector
Last updated:
apr 23, 2017
Indicators value changes by year
Meaning:
0.212
Minimum:
-0.013
jan 1, 2005
Maximum:
0.703
jan 1, 2009
At the date of observation
Value
Absolute change
Change from the previous value
jan 1, 2004
0.022
+0.022
0.0%
jan 1, 2005
-0.013
-0.035
-160.71%
jan 1, 2006
0.024
+0.037
-280.49%
jan 1, 2007
0.0
-0.024
-100.0%
jan 1, 2008
0.0
0.0
%
jan 1, 2009
0.703
+0.703
%
jan 1, 2010
0.648
-0.055
-7.79%
jan 1, 2011
0.45
-0.198
-30.56%
jan 1, 2012
0.392
-0.058
-12.98%
jan 1, 2013
0.317
-0.075
-19.16%
jan 1, 2014
0.0
-0.317
-100.0%
jan 1, 2015
0.0
0.0
%
Ranking of countries by current statistics by years
