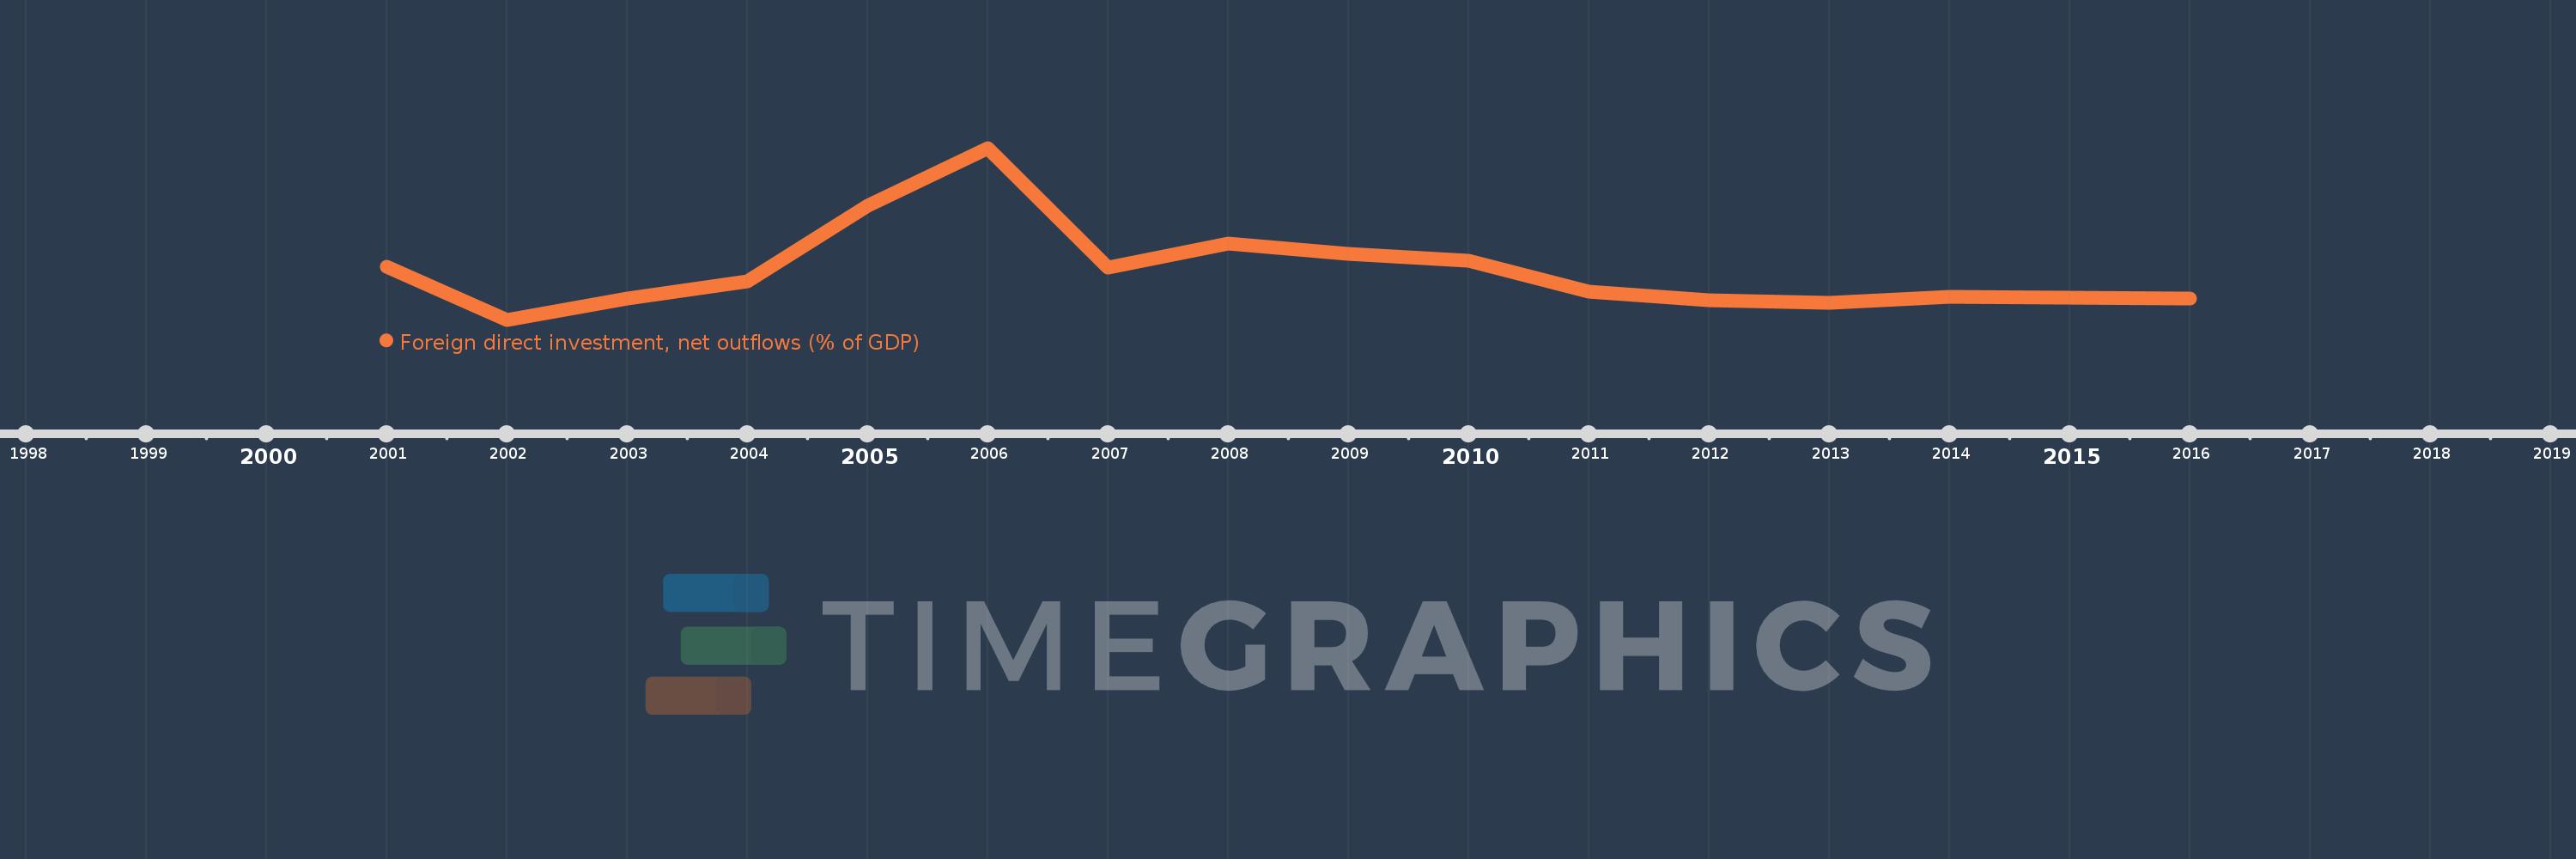
This timeline shows a graph from 2001 to 2016 of St. Kitts and Nevis. No data until 2000. Number of actual observations by date: 16.
Source name:
World Development Indicators
Source organization:
International Monetary Fund, International Financial Statistics and Balance of Payments databases, World Bank, International Debt Statistics, and World Bank and OECD GDP estimates.
Categories, topics:
Economy & Growth, Financial Sector
Last updated:
apr 23, 2017
Indicators value changes by year
Meaning:
0.611
Minimum:
0.027
jan 1, 2002
Maximum:
2.077
jan 1, 2006
At the date of observation
Value
Absolute change
Change from the previous value
jan 1, 2001
0.663
+0.663
0.0%
jan 1, 2002
0.027
-0.636
-95.94%
jan 1, 2003
0.284
+0.257
953.48%
jan 1, 2004
0.489
+0.205
72.34%
jan 1, 2005
1.391
+0.902
184.3%
jan 1, 2006
2.077
+0.686
49.3%
jan 1, 2007
0.651
-1.426
-68.66%
jan 1, 2008
0.934
+0.284
43.58%
jan 1, 2009
0.809
-0.125
-13.41%
jan 1, 2010
0.728
-0.082
-10.08%
jan 1, 2011
0.365
-0.363
-49.85%
jan 1, 2012
0.263
-0.102
-27.95%
jan 1, 2013
0.225
-0.038
-14.29%
jan 1, 2014
0.301
+0.075
33.45%
jan 1, 2015
0.288
-0.012
-4.14%
jan 1, 2016
0.284
-0.004
-1.56%
Ranking of countries by current statistics by years
