29
/
en
AIzaSyAYiBZKx7MnpbEhh9jyipgxe19OcubqV5w
April 1, 2024
235754
Senegal
SEN
true
2
1
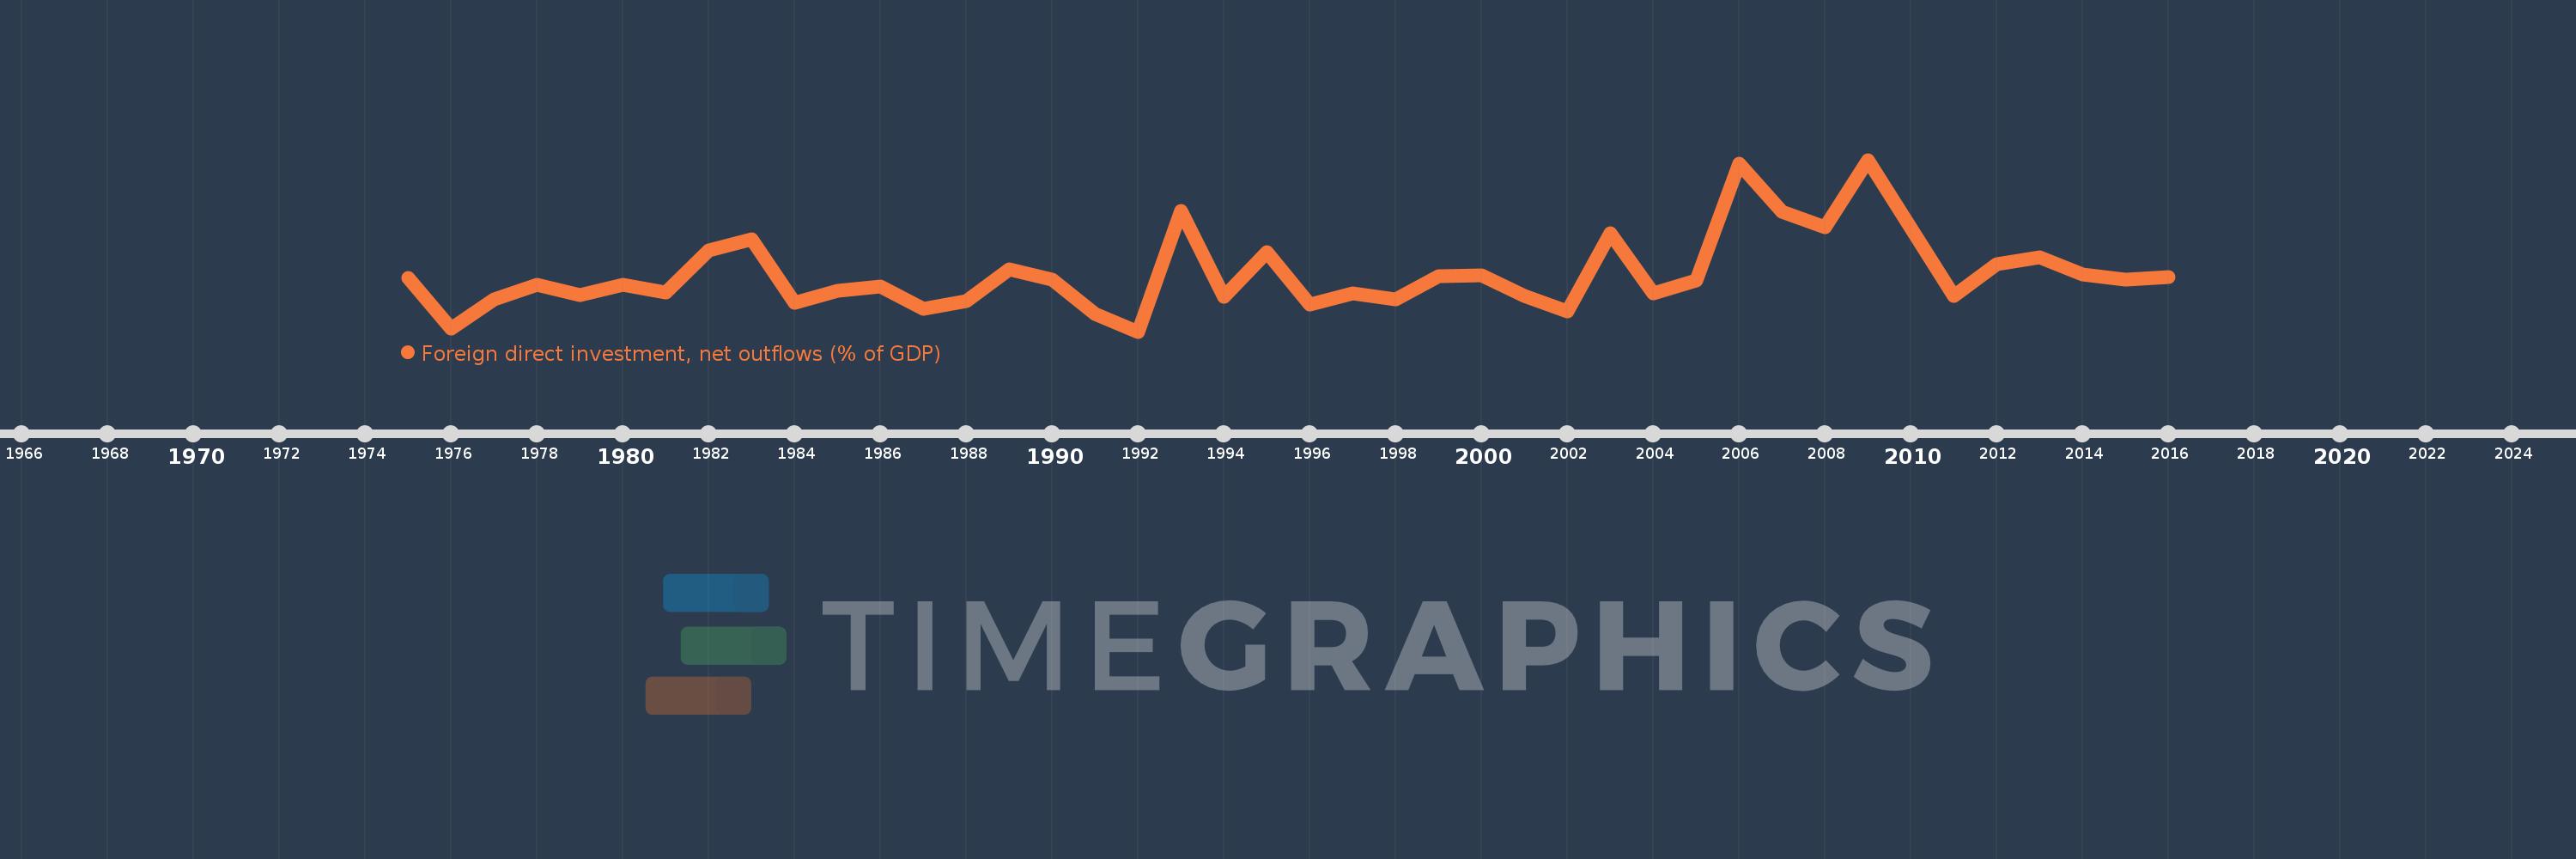
Foreign direct investment, net outflows (% of GDP)
2016,2015,2014,2013,2012,2011,2010,2009,2008,2007,2006,2005,2004,2003,2002,2001,2000,1999,1998,1997,1996,1995,1994,1993,1992,1991,1990,1989,1988,1987,1986,1985,1984,1983,1982,1981,1980,1979,1978,1977,1976,1975
This statistics in other country:
AfghanistanAlbaniaAlgeriaAngolaAntigua and BarbudaArab WorldArgentinaArmeniaArubaAustraliaAustriaAzerbaijanBahamas, TheBahrainBangladeshBarbadosBelarusBelgiumBelizeBeninBermudaBoliviaBosnia and HerzegovinaBotswanaBrazilBrunei DarussalamBulgariaBurkina FasoBurundiCabo VerdeCambodiaCameroonCanadaCaribbean small statesCayman IslandsCentral African RepublicCentral Europe and the BalticsChadChileChinaColombiaComorosCongo, Dem. Rep.Congo, Rep.Costa RicaCote d'IvoireCroatiaCyprusCzech RepublicDenmarkDominicaDominican RepublicEarly-demographic dividendEast Asia & PacificEast Asia & Pacific (excluding high income)East Asia & Pacific (IDA & IBRD countries)EcuadorEgypt, Arab Rep.El SalvadorEquatorial GuineaEritreaEstoniaEuro areaEurope & Central AsiaEurope & Central Asia (excluding high income)Europe & Central Asia (IDA & IBRD countries)European UnionFijiFinlandFragile and conflict affected situationsFranceFrench PolynesiaGabonGambia, TheGeorgiaGermanyGhanaGreeceGrenadaGuatemalaGuineaGuinea-BissauGuyanaHaitiHeavily indebted poor countries (HIPC)High incomeHondurasHong Kong SAR, ChinaHungaryIBRD onlyIcelandIDA & IBRD totalIDA blendIDA onlyIDA totalIndiaIndonesiaIran, Islamic Rep.IraqIrelandIsraelItalyJamaicaJapanJordanKazakhstanKenyaKiribatiKorea, Rep.KosovoKuwaitKyrgyz RepublicLao PDRLate-demographic dividendLatin America & Caribbean Latin America & Caribbean (excluding high income)Latin America & the Caribbean (IDA & IBRD countries)LatviaLeast developed countries: UN classificationLebanonLesothoLiberiaLibyaLithuaniaLow & middle incomeLow incomeLower middle incomeLuxembourgMacao SAR, ChinaMacedonia, FYRMadagascarMalawiMalaysiaMaliMaltaMarshall IslandsMauritaniaMauritiusMexicoMicronesia, Fed. Sts.Middle East & North AfricaMiddle East & North Africa (excluding high income)Middle East & North Africa (IDA & IBRD countries)Middle incomeMoldovaMongoliaMontenegroMoroccoMozambiqueNamibiaNauruNetherlandsNew ZealandNicaraguaNigerNigeriaNorth AmericaNorwayOECD membersOmanOther small statesPacific island small statesPakistanPalauPanamaPapua New GuineaParaguayPeruPhilippinesPolandPortugalPost-demographic dividendPre-demographic dividendQatarRomaniaRussian FederationRwandaSamoaSao Tome and PrincipeSaudi ArabiaSenegalSerbiaSeychellesSierra LeoneSingaporeSlovak RepublicSloveniaSmall statesSolomon IslandsSouth AfricaSouth AsiaSouth Asia (IDA & IBRD)SpainSri LankaSt. Kitts and NevisSt. LuciaSt. Vincent and the GrenadinesSub-Saharan Africa Sub-Saharan Africa (excluding high income)Sub-Saharan Africa (IDA & IBRD countries)SurinameSwazilandSwedenSwitzerlandSyrian Arab RepublicTajikistanTanzaniaThailandTimor-LesteTogoTongaTrinidad and TobagoTunisiaTurkeyUgandaUkraineUnited Arab EmiratesUnited KingdomUnited StatesUpper middle incomeUruguayVanuatuVenezuela, RBVietnamWest Bank and GazaWorldYemen, Rep.ZambiaZimbabwe Timeline:
This timeline shows a graph from 1975 to 2016 of Senegal. No data until 1974. Number of actual observations by date: 42.
Source name:
World Development Indicators
Source organization:
International Monetary Fund, International Financial Statistics and Balance of Payments databases, World Bank, International Debt Statistics, and World Bank and OECD GDP estimates.
Categories, topics:
Economy & Growth, Financial Sector
Last updated:
apr 23, 2017
Indicators value changes by year
Minimum:
-0.341
jan 1, 1992
At the date of observation
Value
Absolute change
Change from previous value
jan 1, 1975
0.195
+0.195
0.0%
jan 1, 1976
-0.307
-0.502
-257.04%
jan 1, 1977
-0.017
+0.29
-94.54%
jan 1, 1978
0.125
+0.141
-842.85%
jan 1, 1979
0.019
-0.106
-84.81%
jan 1, 1980
0.122
+0.104
547.36%
jan 1, 1981
0.045
-0.078
-63.62%
jan 1, 1982
0.465
+0.42
943.4%
jan 1, 1983
0.577
+0.113
24.24%
jan 1, 1984
-0.058
-0.635
-109.99%
jan 1, 1985
0.068
+0.126
-218.56%
jan 1, 1986
0.105
+0.037
54.04%
jan 1, 1987
-0.111
-0.216
-205.37%
jan 1, 1988
-0.037
+0.074
-66.75%
jan 1, 1989
0.276
+0.313
-848.57%
jan 1, 1990
0.175
-0.101
-36.7%
jan 1, 1991
-0.167
-0.342
-195.54%
jan 1, 1992
-0.341
-0.174
103.99%
jan 1, 1993
0.856
+1.196
-351.09%
jan 1, 1994
0.006
-0.849
-99.27%
jan 1, 1995
0.451
+0.444
7.15K%
jan 1, 1996
-0.07
-0.52
-115.49%
jan 1, 1997
0.039
+0.108
-155.28%
jan 1, 1998
-0.018
-0.057
-147.51%
jan 1, 1999
0.206
+0.224
-1.22K%
jan 1, 2000
0.215
+0.009
4.56%
jan 1, 2001
0.014
-0.201
-93.55%
jan 1, 2002
-0.144
-0.158
-1.14K%
jan 1, 2003
0.638
+0.782
-541.91%
jan 1, 2004
0.039
-0.599
-93.92%
jan 1, 2005
0.163
+0.124
319.67%
jan 1, 2006
1.327
+1.164
715.93%
jan 1, 2007
0.846
-0.481
-36.27%
jan 1, 2008
0.694
-0.152
-18.0%
jan 1, 2009
1.365
+0.671
96.76%
jan 1, 2010
0.683
-0.682
-49.95%
jan 1, 2011
0.017
-0.666
-97.48%
jan 1, 2012
0.331
+0.313
1.82K%
jan 1, 2013
0.394
+0.064
19.3%
jan 1, 2014
0.225
-0.169
-42.96%
jan 1, 2015
0.179
-0.046
-20.27%
jan 1, 2016
0.197
+0.018
9.92%
Ranking of countries by current statistics by years


Comments: