29
/
en
AIzaSyAYiBZKx7MnpbEhh9jyipgxe19OcubqV5w
April 1, 2024
209299
New Zealand
NZL
true
2
1
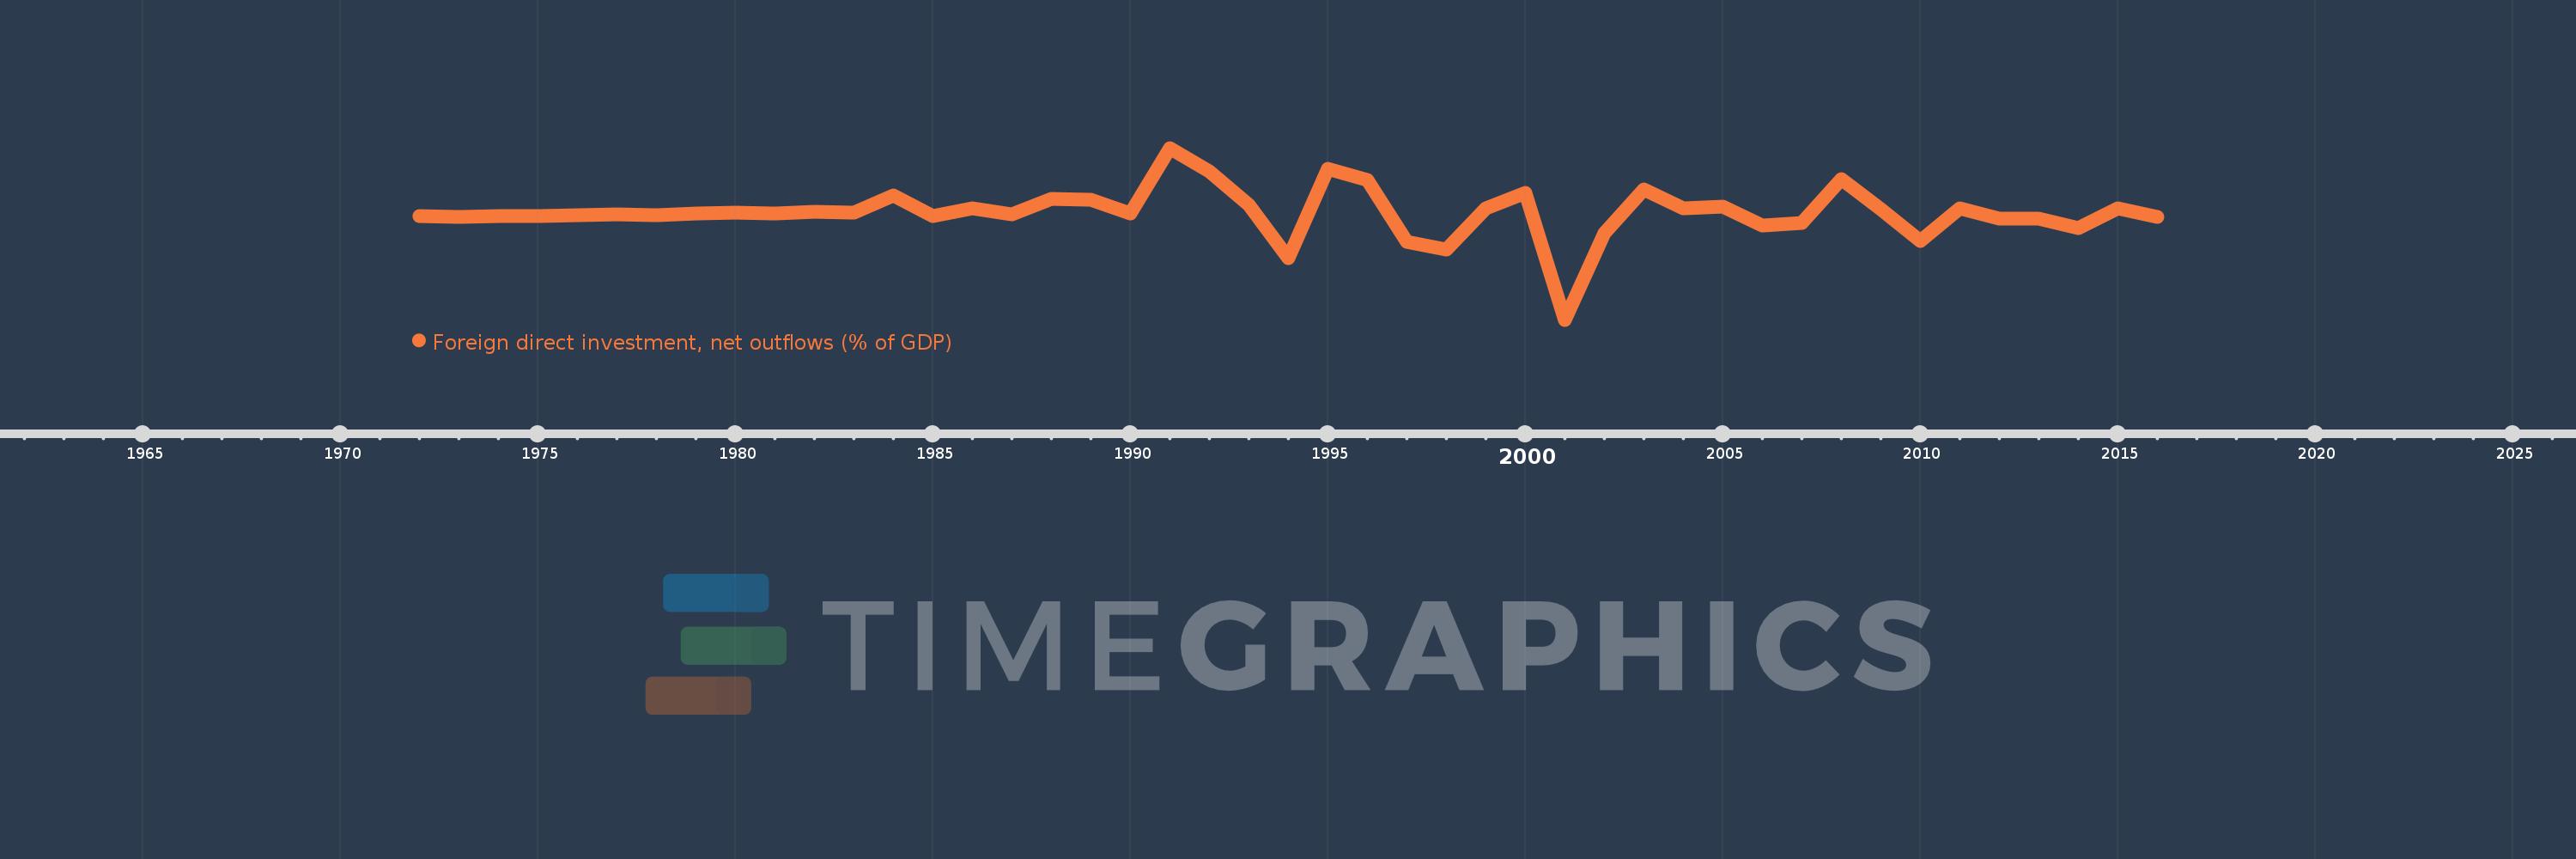
Foreign direct investment, net outflows (% of GDP)
2016,2015,2014,2013,2012,2011,2010,2009,2008,2007,2006,2005,2004,2003,2002,2001,2000,1999,1998,1997,1996,1995,1994,1993,1992,1991,1990,1989,1988,1987,1986,1985,1984,1983,1982,1981,1980,1979,1978,1977,1976,1975,1974,1973,1972
This statistics in other country:
AfghanistanAlbaniaAlgeriaAngolaAntigua and BarbudaArab WorldArgentinaArmeniaArubaAustraliaAustriaAzerbaijanBahamas, TheBahrainBangladeshBarbadosBelarusBelgiumBelizeBeninBermudaBoliviaBosnia and HerzegovinaBotswanaBrazilBrunei DarussalamBulgariaBurkina FasoBurundiCabo VerdeCambodiaCameroonCanadaCaribbean small statesCayman IslandsCentral African RepublicCentral Europe and the BalticsChadChileChinaColombiaComorosCongo, Dem. Rep.Congo, Rep.Costa RicaCote d'IvoireCroatiaCyprusCzech RepublicDenmarkDominicaDominican RepublicEarly-demographic dividendEast Asia & PacificEast Asia & Pacific (excluding high income)East Asia & Pacific (IDA & IBRD countries)EcuadorEgypt, Arab Rep.El SalvadorEquatorial GuineaEritreaEstoniaEuro areaEurope & Central AsiaEurope & Central Asia (excluding high income)Europe & Central Asia (IDA & IBRD countries)European UnionFijiFinlandFragile and conflict affected situationsFranceFrench PolynesiaGabonGambia, TheGeorgiaGermanyGhanaGreeceGrenadaGuatemalaGuineaGuinea-BissauGuyanaHaitiHeavily indebted poor countries (HIPC)High incomeHondurasHong Kong SAR, ChinaHungaryIBRD onlyIcelandIDA & IBRD totalIDA blendIDA onlyIDA totalIndiaIndonesiaIran, Islamic Rep.IraqIrelandIsraelItalyJamaicaJapanJordanKazakhstanKenyaKiribatiKorea, Rep.KosovoKuwaitKyrgyz RepublicLao PDRLate-demographic dividendLatin America & Caribbean Latin America & Caribbean (excluding high income)Latin America & the Caribbean (IDA & IBRD countries)LatviaLeast developed countries: UN classificationLebanonLesothoLiberiaLibyaLithuaniaLow & middle incomeLow incomeLower middle incomeLuxembourgMacao SAR, ChinaMacedonia, FYRMadagascarMalawiMalaysiaMaliMaltaMarshall IslandsMauritaniaMauritiusMexicoMicronesia, Fed. Sts.Middle East & North AfricaMiddle East & North Africa (excluding high income)Middle East & North Africa (IDA & IBRD countries)Middle incomeMoldovaMongoliaMontenegroMoroccoMozambiqueNamibiaNauruNetherlandsNew ZealandNicaraguaNigerNigeriaNorth AmericaNorwayOECD membersOmanOther small statesPacific island small statesPakistanPalauPanamaPapua New GuineaParaguayPeruPhilippinesPolandPortugalPost-demographic dividendPre-demographic dividendQatarRomaniaRussian FederationRwandaSamoaSao Tome and PrincipeSaudi ArabiaSenegalSerbiaSeychellesSierra LeoneSingaporeSlovak RepublicSloveniaSmall statesSolomon IslandsSouth AfricaSouth AsiaSouth Asia (IDA & IBRD)SpainSri LankaSt. Kitts and NevisSt. LuciaSt. Vincent and the GrenadinesSub-Saharan Africa Sub-Saharan Africa (excluding high income)Sub-Saharan Africa (IDA & IBRD countries)SurinameSwazilandSwedenSwitzerlandSyrian Arab RepublicTajikistanTanzaniaThailandTimor-LesteTogoTongaTrinidad and TobagoTunisiaTurkeyUgandaUkraineUnited Arab EmiratesUnited KingdomUnited StatesUpper middle incomeUruguayVanuatuVenezuela, RBVietnamWest Bank and GazaWorldYemen, Rep.ZambiaZimbabwe Timeline:
This timeline shows a graph from 1972 to 2016 of New Zealand. No data until 1971. Number of actual observations by date: 45.
Source name:
World Development Indicators
Source organization:
International Monetary Fund, International Financial Statistics and Balance of Payments databases, World Bank, International Debt Statistics, and World Bank and OECD GDP estimates.
Categories, topics:
Economy & Growth, Financial Sector
Last updated:
apr 23, 2017
Indicators value changes by year
Minimum:
-7.575
jan 1, 2001
At the date of observation
Value
Absolute change
Change from previous value
jan 1, 1972
0.152
+0.152
0.0%
jan 1, 1973
0.038
-0.114
-75.26%
jan 1, 1974
0.148
+0.111
295.51%
jan 1, 1975
0.15
+0.002
1.36%
jan 1, 1976
0.168
+0.018
11.79%
jan 1, 1977
0.263
+0.095
56.56%
jan 1, 1978
0.207
-0.056
-21.24%
jan 1, 1979
0.302
+0.095
45.71%
jan 1, 1980
0.36
+0.058
19.09%
jan 1, 1981
0.306
-0.054
-15.0%
jan 1, 1982
0.419
+0.113
37.05%
jan 1, 1983
0.357
-0.062
-14.81%
jan 1, 1984
1.66
+1.303
364.84%
jan 1, 1985
0.141
-1.519
-91.49%
jan 1, 1986
0.699
+0.558
394.62%
jan 1, 1987
0.284
-0.415
-59.43%
jan 1, 1988
1.387
+1.103
389.23%
jan 1, 1989
1.36
-0.027
-1.93%
jan 1, 1990
0.308
-1.053
-77.38%
jan 1, 1991
5.194
+4.886
1.59K%
jan 1, 1992
3.436
-1.758
-33.85%
jan 1, 1993
0.939
-2.497
-72.68%
jan 1, 1994
-2.969
-3.908
-416.25%
jan 1, 1995
3.632
+6.601
-222.31%
jan 1, 1996
2.79
-0.841
-23.16%
jan 1, 1997
-1.766
-4.556
-163.28%
jan 1, 1998
-2.37
-0.604
34.19%
jan 1, 1999
0.714
+3.084
-130.13%
jan 1, 2000
1.827
+1.113
155.94%
jan 1, 2001
-7.575
-9.402
-514.52%
jan 1, 2002
-1.127
+6.447
-85.12%
jan 1, 2003
2.111
+3.239
-287.29%
jan 1, 2004
0.731
-1.38
-65.36%
jan 1, 2005
0.822
+0.09
12.35%
jan 1, 2006
-0.559
-1.38
-167.99%
jan 1, 2007
-0.358
+0.2
-35.87%
jan 1, 2008
2.906
+3.264
-911.17%
jan 1, 2009
0.63
-2.276
-78.33%
jan 1, 2010
-1.708
-2.338
-371.25%
jan 1, 2011
0.705
+2.413
-141.27%
jan 1, 2012
-0.071
-0.776
-110.13%
jan 1, 2013
-0.051
+0.02
-28.11%
jan 1, 2014
-0.742
-0.69
1.34K%
jan 1, 2015
0.711
+1.452
-195.83%
jan 1, 2016
0.049
-0.661
-93.08%
Ranking of countries by current statistics by years


Comments: