29
/
en
AIzaSyAYiBZKx7MnpbEhh9jyipgxe19OcubqV5w
April 1, 2024
219562
Papua New Guinea
PNG
true
2
1
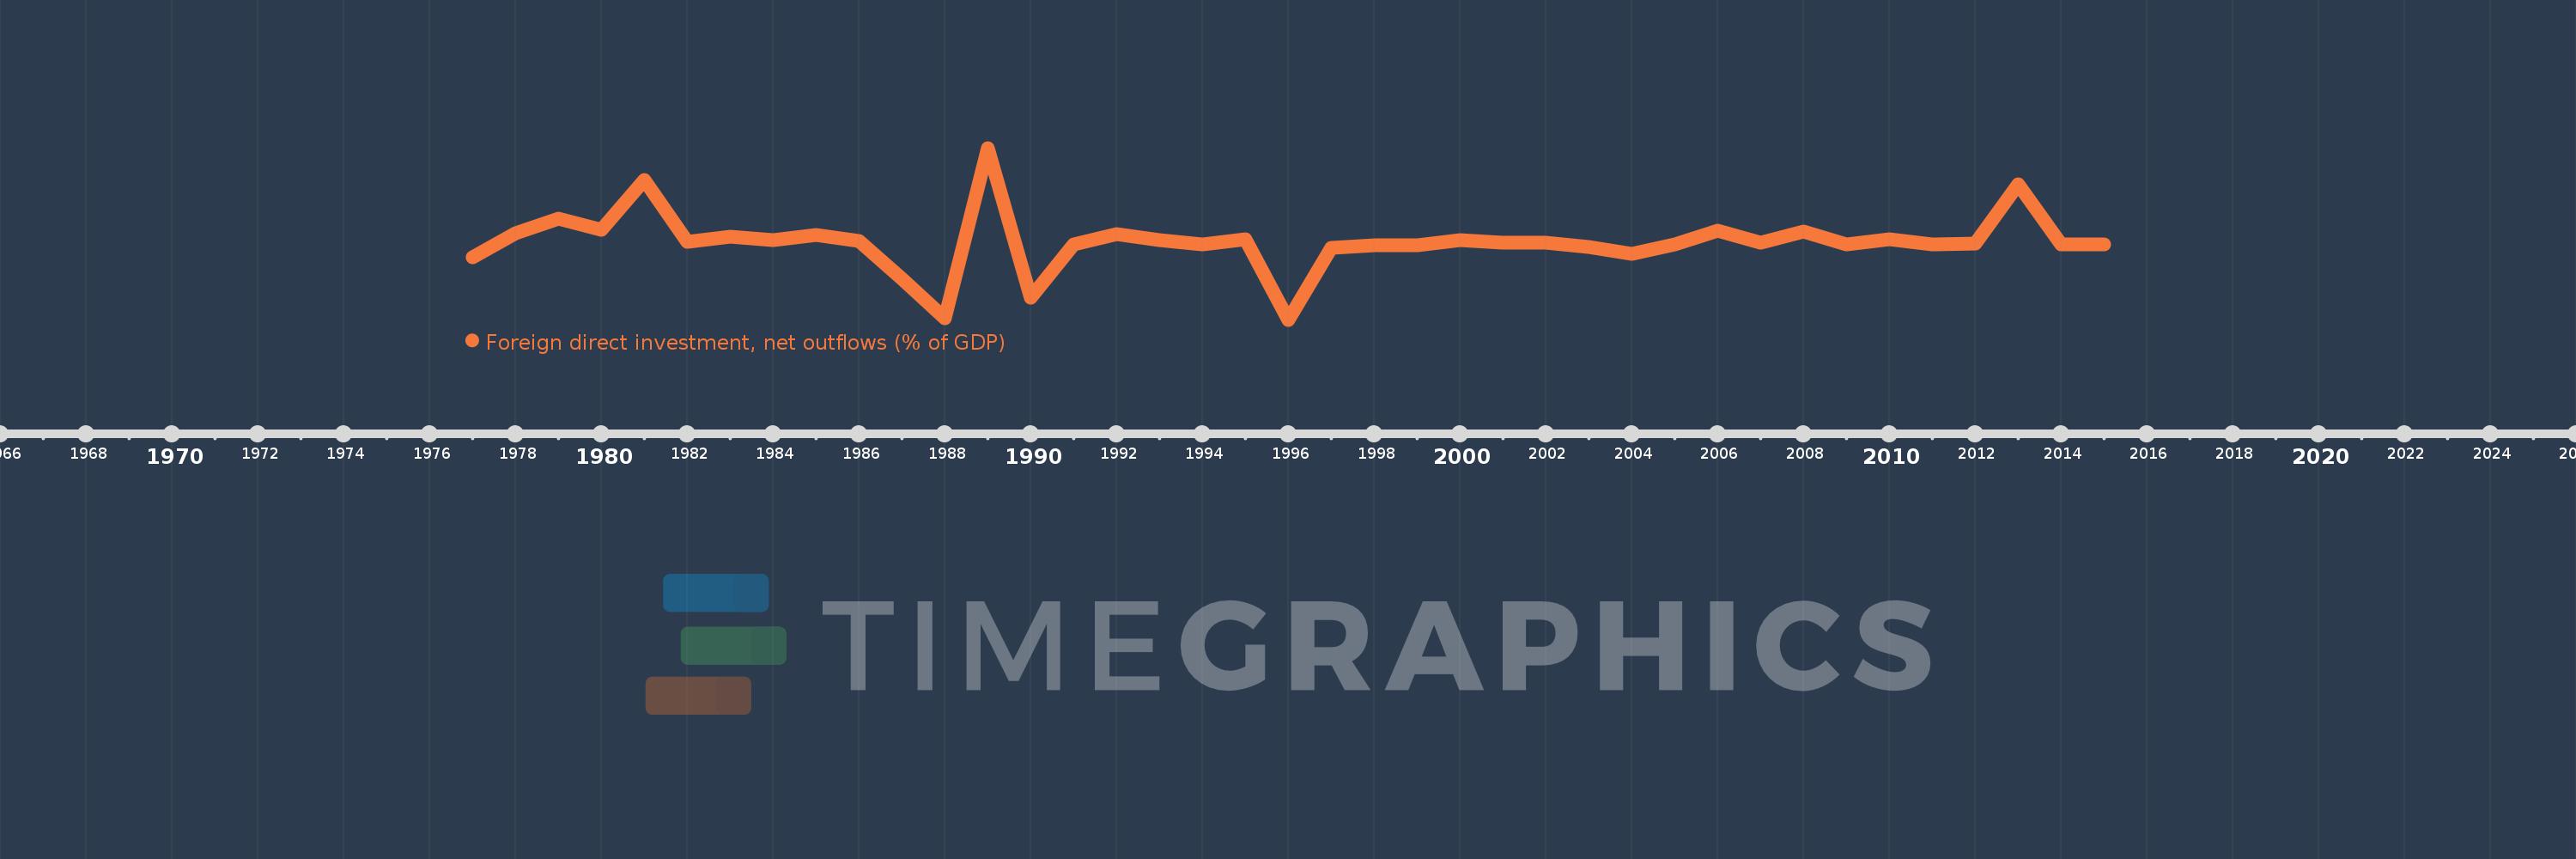
Foreign direct investment, net outflows (% of GDP)
2015,2014,2013,2012,2011,2010,2009,2008,2007,2006,2005,2004,2003,2002,2001,2000,1999,1998,1997,1996,1995,1994,1993,1992,1991,1990,1989,1988,1987,1986,1985,1984,1983,1982,1981,1980,1979,1978,1977
This statistics in other country:
AfghanistanAlbaniaAlgeriaAngolaAntigua and BarbudaArab WorldArgentinaArmeniaArubaAustraliaAustriaAzerbaijanBahamas, TheBahrainBangladeshBarbadosBelarusBelgiumBelizeBeninBermudaBoliviaBosnia and HerzegovinaBotswanaBrazilBrunei DarussalamBulgariaBurkina FasoBurundiCabo VerdeCambodiaCameroonCanadaCaribbean small statesCayman IslandsCentral African RepublicCentral Europe and the BalticsChadChileChinaColombiaComorosCongo, Dem. Rep.Congo, Rep.Costa RicaCote d'IvoireCroatiaCyprusCzech RepublicDenmarkDominicaDominican RepublicEarly-demographic dividendEast Asia & PacificEast Asia & Pacific (excluding high income)East Asia & Pacific (IDA & IBRD countries)EcuadorEgypt, Arab Rep.El SalvadorEquatorial GuineaEritreaEstoniaEuro areaEurope & Central AsiaEurope & Central Asia (excluding high income)Europe & Central Asia (IDA & IBRD countries)European UnionFijiFinlandFragile and conflict affected situationsFranceFrench PolynesiaGabonGambia, TheGeorgiaGermanyGhanaGreeceGrenadaGuatemalaGuineaGuinea-BissauGuyanaHaitiHeavily indebted poor countries (HIPC)High incomeHondurasHong Kong SAR, ChinaHungaryIBRD onlyIcelandIDA & IBRD totalIDA blendIDA onlyIDA totalIndiaIndonesiaIran, Islamic Rep.IraqIrelandIsraelItalyJamaicaJapanJordanKazakhstanKenyaKiribatiKorea, Rep.KosovoKuwaitKyrgyz RepublicLao PDRLate-demographic dividendLatin America & Caribbean Latin America & Caribbean (excluding high income)Latin America & the Caribbean (IDA & IBRD countries)LatviaLeast developed countries: UN classificationLebanonLesothoLiberiaLibyaLithuaniaLow & middle incomeLow incomeLower middle incomeLuxembourgMacao SAR, ChinaMacedonia, FYRMadagascarMalawiMalaysiaMaliMaltaMarshall IslandsMauritaniaMauritiusMexicoMicronesia, Fed. Sts.Middle East & North AfricaMiddle East & North Africa (excluding high income)Middle East & North Africa (IDA & IBRD countries)Middle incomeMoldovaMongoliaMontenegroMoroccoMozambiqueNamibiaNauruNetherlandsNew ZealandNicaraguaNigerNigeriaNorth AmericaNorwayOECD membersOmanOther small statesPacific island small statesPakistanPalauPanamaPapua New GuineaParaguayPeruPhilippinesPolandPortugalPost-demographic dividendPre-demographic dividendQatarRomaniaRussian FederationRwandaSamoaSao Tome and PrincipeSaudi ArabiaSenegalSerbiaSeychellesSierra LeoneSingaporeSlovak RepublicSloveniaSmall statesSolomon IslandsSouth AfricaSouth AsiaSouth Asia (IDA & IBRD)SpainSri LankaSt. Kitts and NevisSt. LuciaSt. Vincent and the GrenadinesSub-Saharan Africa Sub-Saharan Africa (excluding high income)Sub-Saharan Africa (IDA & IBRD countries)SurinameSwazilandSwedenSwitzerlandSyrian Arab RepublicTajikistanTanzaniaThailandTimor-LesteTogoTongaTrinidad and TobagoTunisiaTurkeyUgandaUkraineUnited Arab EmiratesUnited KingdomUnited StatesUpper middle incomeUruguayVanuatuVenezuela, RBVietnamWest Bank and GazaWorldYemen, Rep.ZambiaZimbabwe Timeline:
This timeline shows a graph from 1977 to 2015 of Papua New Guinea. No data until 1976. Number of actual observations by date: 39.
Source name:
World Development Indicators
Source organization:
International Monetary Fund, International Financial Statistics and Balance of Payments databases, World Bank, International Debt Statistics, and World Bank and OECD GDP estimates.
Categories, topics:
Economy & Growth, Financial Sector
Last updated:
apr 23, 2017
Indicators value changes by year
Minimum:
-0.719
jan 1, 1996
At the date of observation
Value
Absolute change
Change from previous value
jan 1, 1977
-0.125
-0.125
0.0%
jan 1, 1978
0.108
+0.233
-186.69%
jan 1, 1979
0.25
+0.142
131.01%
jan 1, 1980
0.141
-0.109
-43.62%
jan 1, 1981
0.618
+0.477
339.21%
jan 1, 1982
0.025
-0.593
-96.0%
jan 1, 1983
0.075
+0.05
202.97%
jan 1, 1984
0.044
-0.031
-41.41%
jan 1, 1985
0.089
+0.045
102.85%
jan 1, 1986
0.038
-0.051
-57.43%
jan 1, 1987
-0.329
-0.367
-968.6%
jan 1, 1988
-0.707
-0.378
114.93%
jan 1, 1989
0.925
+1.633
-230.87%
jan 1, 1990
-0.504
-1.429
-154.44%
jan 1, 1991
0.001
+0.505
-100.17%
jan 1, 1992
0.102
+0.102
12.2K%
jan 1, 1993
0.047
-0.056
-54.43%
jan 1, 1994
0.002
-0.045
-95.62%
jan 1, 1995
0.05
+0.048
2.35K%
jan 1, 1996
-0.719
-0.769
-1.53K%
jan 1, 1997
-0.028
+0.691
-96.06%
jan 1, 1998
-0.005
+0.023
-81.24%
jan 1, 1999
-0.005
+0.0
-6.93%
jan 1, 2000
0.044
+0.049
-989.96%
jan 1, 2001
0.016
-0.028
-63.62%
jan 1, 2002
0.021
+0.005
30.2%
jan 1, 2003
-0.026
-0.047
-223.07%
jan 1, 2004
-0.086
-0.06
233.77%
jan 1, 2005
0.002
+0.087
-101.84%
jan 1, 2006
0.133
+0.131
8.28K%
jan 1, 2007
0.018
-0.115
-86.6%
jan 1, 2008
0.122
+0.105
588.98%
jan 1, 2009
0.0
-0.122
-100.0%
jan 1, 2010
0.054
+0.054
1.16 mln%
jan 1, 2011
0.004
-0.05
-92.96%
jan 1, 2012
0.007
+0.003
73.13%
jan 1, 2013
0.577
+0.57
8.7K%
jan 1, 2014
0.0
-0.577
-100.0%
Ranking of countries by current statistics by years


Comments: