29
/
en
AIzaSyAYiBZKx7MnpbEhh9jyipgxe19OcubqV5w
April 1, 2024
275673
United Kingdom
GBR
true
2
1
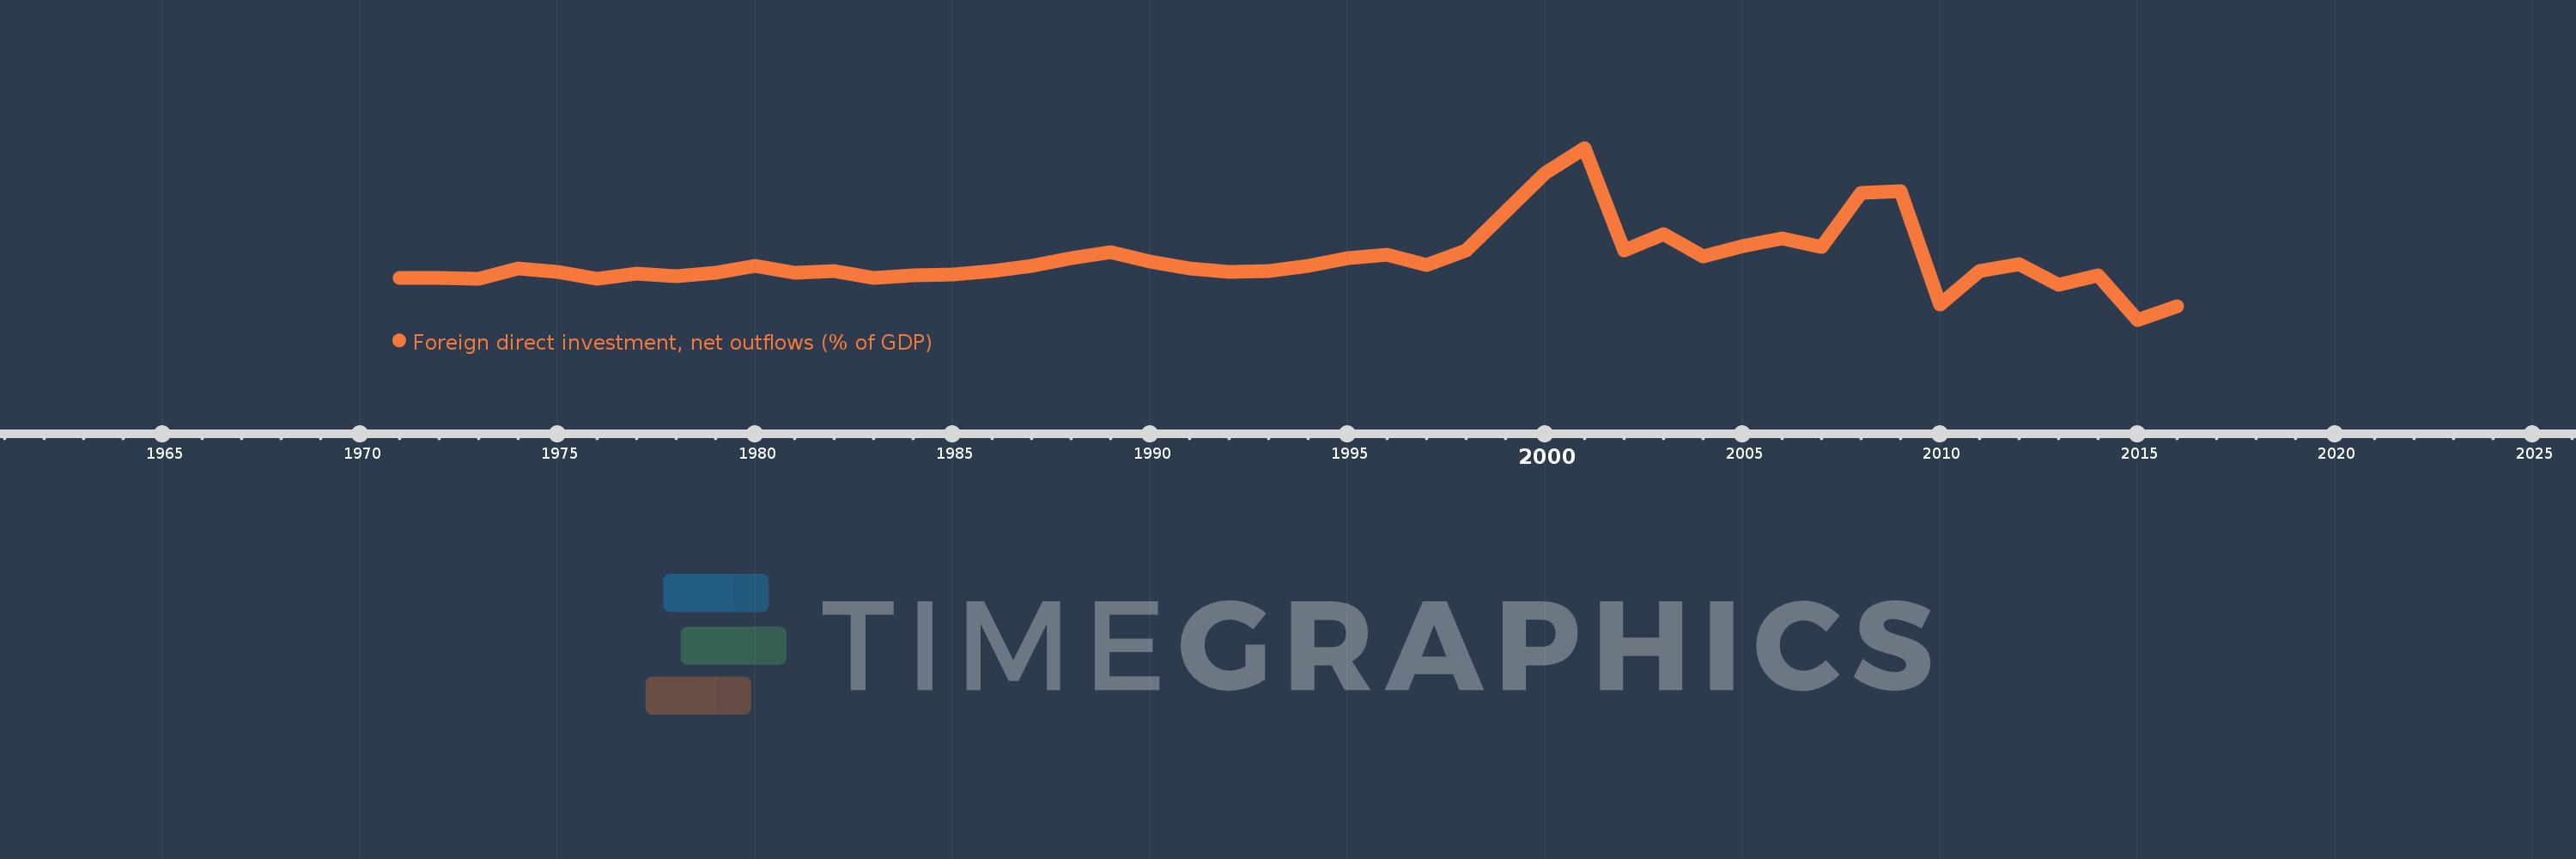
Foreign direct investment, net outflows (% of GDP)
2016,2015,2014,2013,2012,2011,2010,2009,2008,2007,2006,2005,2004,2003,2002,2001,2000,1999,1998,1997,1996,1995,1994,1993,1992,1991,1990,1989,1988,1987,1986,1985,1984,1983,1982,1981,1980,1979,1978,1977,1976,1975,1974,1973,1972,1971
This statistics in other country:
AfghanistanAlbaniaAlgeriaAngolaAntigua and BarbudaArab WorldArgentinaArmeniaArubaAustraliaAustriaAzerbaijanBahamas, TheBahrainBangladeshBarbadosBelarusBelgiumBelizeBeninBermudaBoliviaBosnia and HerzegovinaBotswanaBrazilBrunei DarussalamBulgariaBurkina FasoBurundiCabo VerdeCambodiaCameroonCanadaCaribbean small statesCayman IslandsCentral African RepublicCentral Europe and the BalticsChadChileChinaColombiaComorosCongo, Dem. Rep.Congo, Rep.Costa RicaCote d'IvoireCroatiaCyprusCzech RepublicDenmarkDominicaDominican RepublicEarly-demographic dividendEast Asia & PacificEast Asia & Pacific (excluding high income)East Asia & Pacific (IDA & IBRD countries)EcuadorEgypt, Arab Rep.El SalvadorEquatorial GuineaEritreaEstoniaEuro areaEurope & Central AsiaEurope & Central Asia (excluding high income)Europe & Central Asia (IDA & IBRD countries)European UnionFijiFinlandFragile and conflict affected situationsFranceFrench PolynesiaGabonGambia, TheGeorgiaGermanyGhanaGreeceGrenadaGuatemalaGuineaGuinea-BissauGuyanaHaitiHeavily indebted poor countries (HIPC)High incomeHondurasHong Kong SAR, ChinaHungaryIBRD onlyIcelandIDA & IBRD totalIDA blendIDA onlyIDA totalIndiaIndonesiaIran, Islamic Rep.IraqIrelandIsraelItalyJamaicaJapanJordanKazakhstanKenyaKiribatiKorea, Rep.KosovoKuwaitKyrgyz RepublicLao PDRLate-demographic dividendLatin America & Caribbean Latin America & Caribbean (excluding high income)Latin America & the Caribbean (IDA & IBRD countries)LatviaLeast developed countries: UN classificationLebanonLesothoLiberiaLibyaLithuaniaLow & middle incomeLow incomeLower middle incomeLuxembourgMacao SAR, ChinaMacedonia, FYRMadagascarMalawiMalaysiaMaliMaltaMarshall IslandsMauritaniaMauritiusMexicoMicronesia, Fed. Sts.Middle East & North AfricaMiddle East & North Africa (excluding high income)Middle East & North Africa (IDA & IBRD countries)Middle incomeMoldovaMongoliaMontenegroMoroccoMozambiqueNamibiaNauruNetherlandsNew ZealandNicaraguaNigerNigeriaNorth AmericaNorwayOECD membersOmanOther small statesPacific island small statesPakistanPalauPanamaPapua New GuineaParaguayPeruPhilippinesPolandPortugalPost-demographic dividendPre-demographic dividendQatarRomaniaRussian FederationRwandaSamoaSao Tome and PrincipeSaudi ArabiaSenegalSerbiaSeychellesSierra LeoneSingaporeSlovak RepublicSloveniaSmall statesSolomon IslandsSouth AfricaSouth AsiaSouth Asia (IDA & IBRD)SpainSri LankaSt. Kitts and NevisSt. LuciaSt. Vincent and the GrenadinesSub-Saharan Africa Sub-Saharan Africa (excluding high income)Sub-Saharan Africa (IDA & IBRD countries)SurinameSwazilandSwedenSwitzerlandSyrian Arab RepublicTajikistanTanzaniaThailandTimor-LesteTogoTongaTrinidad and TobagoTunisiaTurkeyUgandaUkraineUnited Arab EmiratesUnited KingdomUnited StatesUpper middle incomeUruguayVanuatuVenezuela, RBVietnamWest Bank and GazaWorldYemen, Rep.ZambiaZimbabwe Timeline:
This timeline shows a graph from 1971 to 2016 of United Kingdom. No data until 1970. Number of actual observations by date: 46.
Source name:
World Development Indicators
Source organization:
International Monetary Fund, International Financial Statistics and Balance of Payments databases, World Bank, International Debt Statistics, and World Bank and OECD GDP estimates.
Categories, topics:
Economy & Growth, Financial Sector
Last updated:
apr 23, 2017
Indicators value changes by year
Minimum:
-3.981
jan 1, 2015
Maximum:
17.857
jan 1, 2001
At the date of observation
Value
Absolute change
Change from previous value
jan 1, 1971
1.284
+1.284
0.0%
jan 1, 1972
1.342
+0.058
4.56%
jan 1, 1973
1.187
-0.155
-11.57%
jan 1, 1974
2.587
+1.4
117.97%
jan 1, 1975
2.123
-0.464
-17.95%
jan 1, 1976
1.241
-0.882
-41.53%
jan 1, 1977
1.865
+0.624
50.24%
jan 1, 1978
1.586
-0.278
-14.93%
jan 1, 1979
2.029
+0.443
27.9%
jan 1, 1980
2.856
+0.827
40.77%
jan 1, 1981
1.988
-0.869
-30.41%
jan 1, 1982
2.247
+0.26
13.07%
jan 1, 1983
1.391
-0.857
-38.12%
jan 1, 1984
1.672
+0.281
20.19%
jan 1, 1985
1.729
+0.057
3.42%
jan 1, 1986
2.168
+0.439
25.4%
jan 1, 1987
2.83
+0.662
30.53%
jan 1, 1988
3.882
+1.052
37.19%
jan 1, 1989
4.575
+0.693
17.85%
jan 1, 1990
3.385
-1.189
-26.0%
jan 1, 1991
2.56
-0.825
-24.38%
jan 1, 1992
2.06
-0.499
-19.51%
jan 1, 1993
2.217
+0.156
7.59%
jan 1, 1994
2.866
+0.649
29.29%
jan 1, 1995
3.835
+0.968
33.78%
jan 1, 1996
4.28
+0.446
11.62%
jan 1, 1997
2.995
-1.286
-30.04%
jan 1, 1998
4.86
+1.865
62.28%
jan 1, 1999
9.73
+4.87
100.22%
jan 1, 2000
14.669
+4.939
50.76%
jan 1, 2001
17.857
+3.188
21.73%
jan 1, 2002
4.799
-13.058
-73.13%
jan 1, 2003
6.879
+2.08
43.34%
jan 1, 2004
4.046
-2.833
-41.18%
jan 1, 2005
5.385
+1.339
33.08%
jan 1, 2006
6.376
+0.991
18.41%
jan 1, 2007
5.311
-1.064
-16.69%
jan 1, 2008
12.093
+6.781
127.67%
jan 1, 2009
12.405
+0.312
2.58%
jan 1, 2010
-2.045
-14.449
-116.48%
jan 1, 2011
2.239
+4.284
-209.53%
jan 1, 2012
3.098
+0.859
38.36%
jan 1, 2013
0.454
-2.644
-85.33%
jan 1, 2014
1.701
+1.246
274.27%
jan 1, 2015
-3.981
-5.681
-334.06%
jan 1, 2016
-2.241
+1.74
-43.71%
Ranking of countries by current statistics by years


Comments: